Published: 2026-03-27T03:01:35.000Z
Chart USD/THB Update: Retest 33.00/05 highs
1
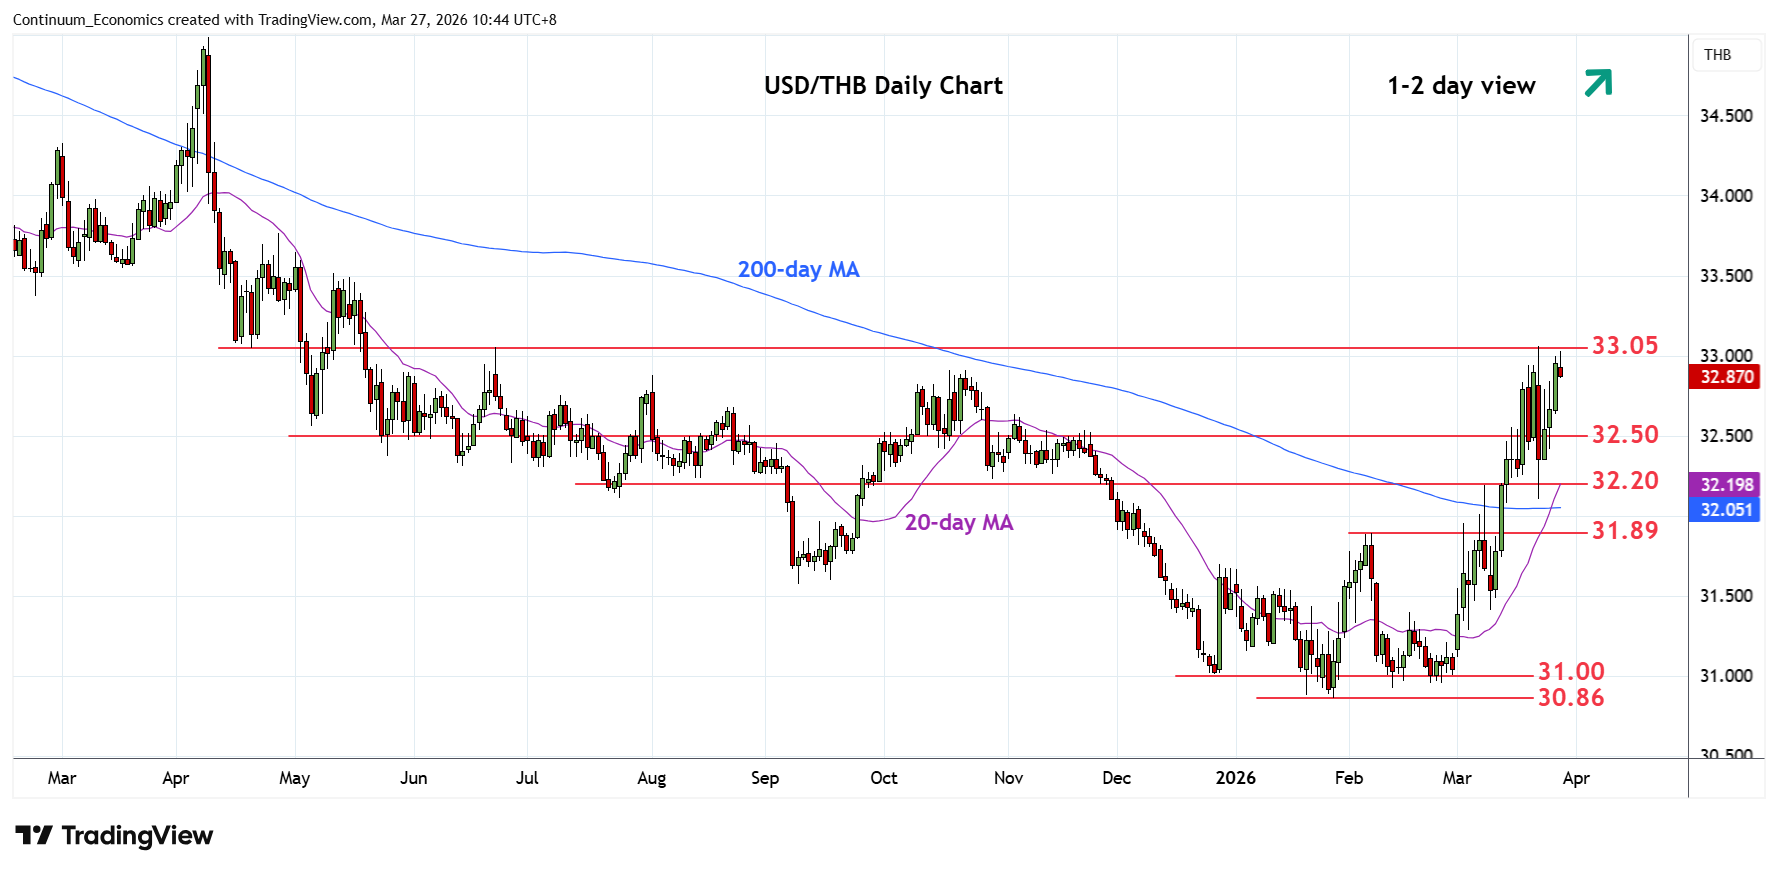
Extend bounce from the Monday's low at 32.10 low to retest the 33.00/05 congestion and 23 March YTD high
| Level | Comment | Level | Comment | |||||
|---|---|---|---|---|---|---|---|---|
| R4 | 33.50 | * | congestion | S1 | 32.50/35 | * | congestion | |
| R3 | 33.42 | * | 61.8% 2025/Jan fall | S2 | 32.20 | * | congestion | |
| R2 | 33.20 | * | congestion | S3 | 32.10 | * | 23 Mar low | |
| R1 | 33.00/05 | ** | figure, 23 Mar YTD high | S4 | 31.89 | ** | Feb high |
Asterisk denotes strength of level
02:50 GMT - Extend bounce from the Monday's low at 32.10 low to retest the 33.00/05 congestion and 23 March YTD high. Break here will open up room for further gains to retrace losses from the March 2025 year high and see room to resistance at the 33.20 congestion. Higher still, will see scope to 33.42, 61.8% Fibonacci retracement. Meanwhile, support at the 32.50/32.35 congestion area should now underpin. Failure here, will return focus to the downside for retest of support at the 32.20 congestion and 32.10 low.