Published: 2025-11-04T03:39:39.000Z
Chart USD/MYR Update: Higher in consolidation from 4.1900/4.1800 lows
1
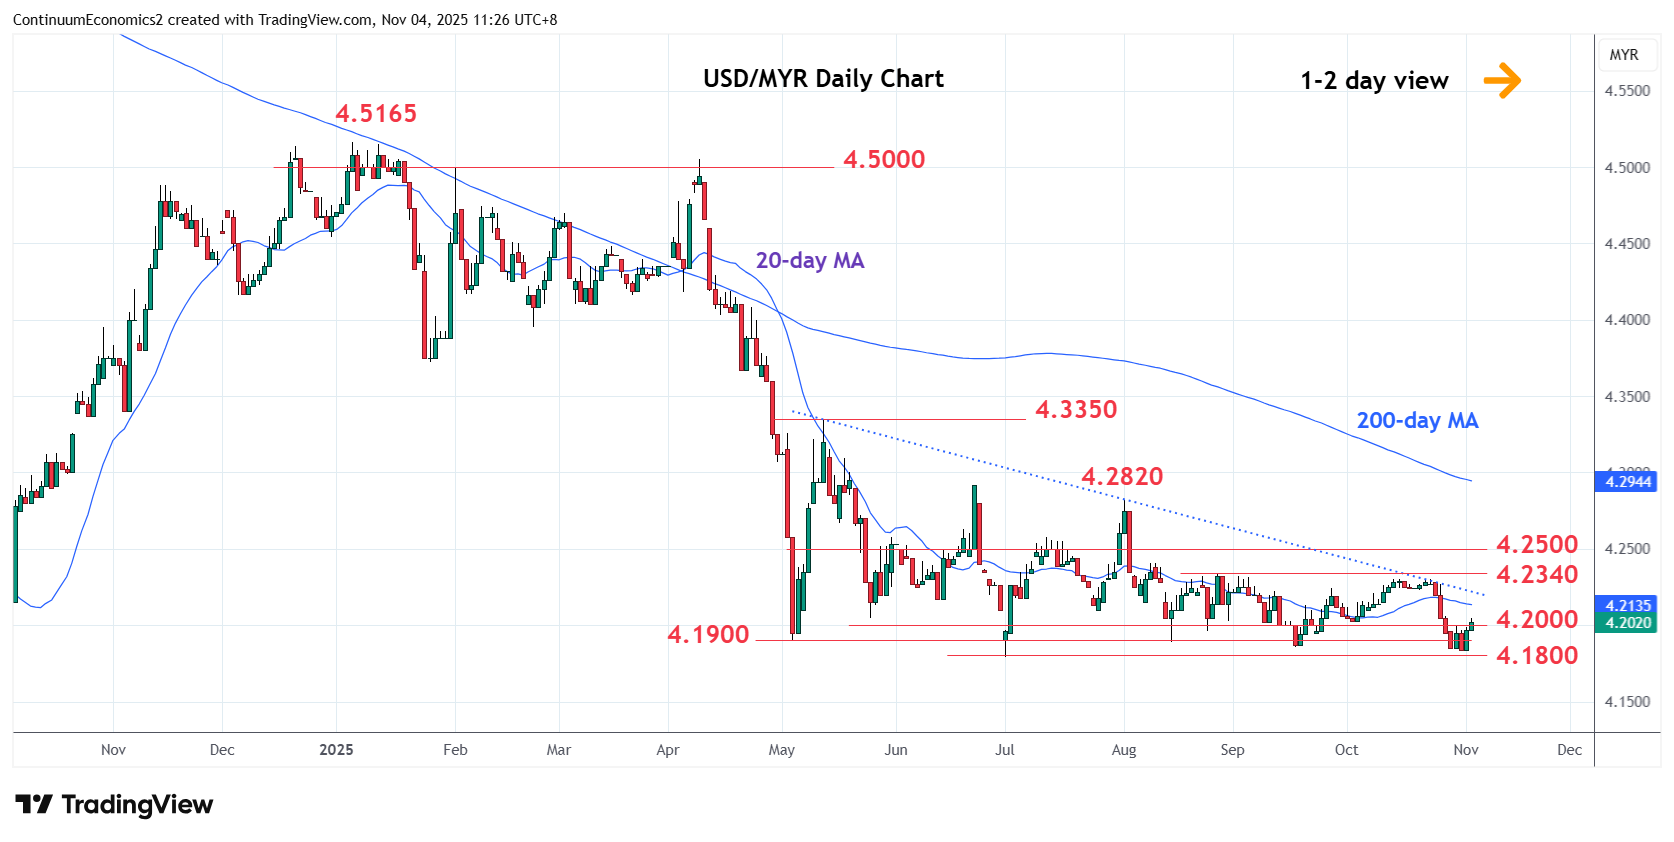
Turned up in consolidation from support at the 4.1900 and 4.1800, May and 1 July current year lows
| Levels | Imp | Comment | Levels | Imp | Comment | |||
|---|---|---|---|---|---|---|---|---|
| R4 | 4.2500 | * | congestion | S1 | 4.1900 | * | May low | |
| R3 | 4.2400 | * | 8 Aug high | S2 | 4.1800 | ** | 1 Jul YTD low | |
| R2 | 4.2300/40 | ** | congestion, 27 Aug high | S3 | 4.1500 | * | congestion | |
| R1 | 4.2230 | * | 21 Oct low | S4 | 4.1150 | * | 25 Sep 2024 low |
Asterisk denotes strength of level
03:30 GMT - Turned up in consolidation from support at the 4.1900 and 4.1800, May and 1 July current year lows. Bounce here see prices unwinding oversold intraday and daily studies and consolidating losses from the 4.2300 high. Above the 4.2000 level will see room to resistance at the 4.2200/4.2230 area. Clearance will expose the 4.2300/40 highs to retest where reaction is expected. Lower high sought to pressure the downside later. Below the 4.1800 low will see room to the 4.1500 congestion. Lower will see potential to retest 4.1000, September 2024 year low.