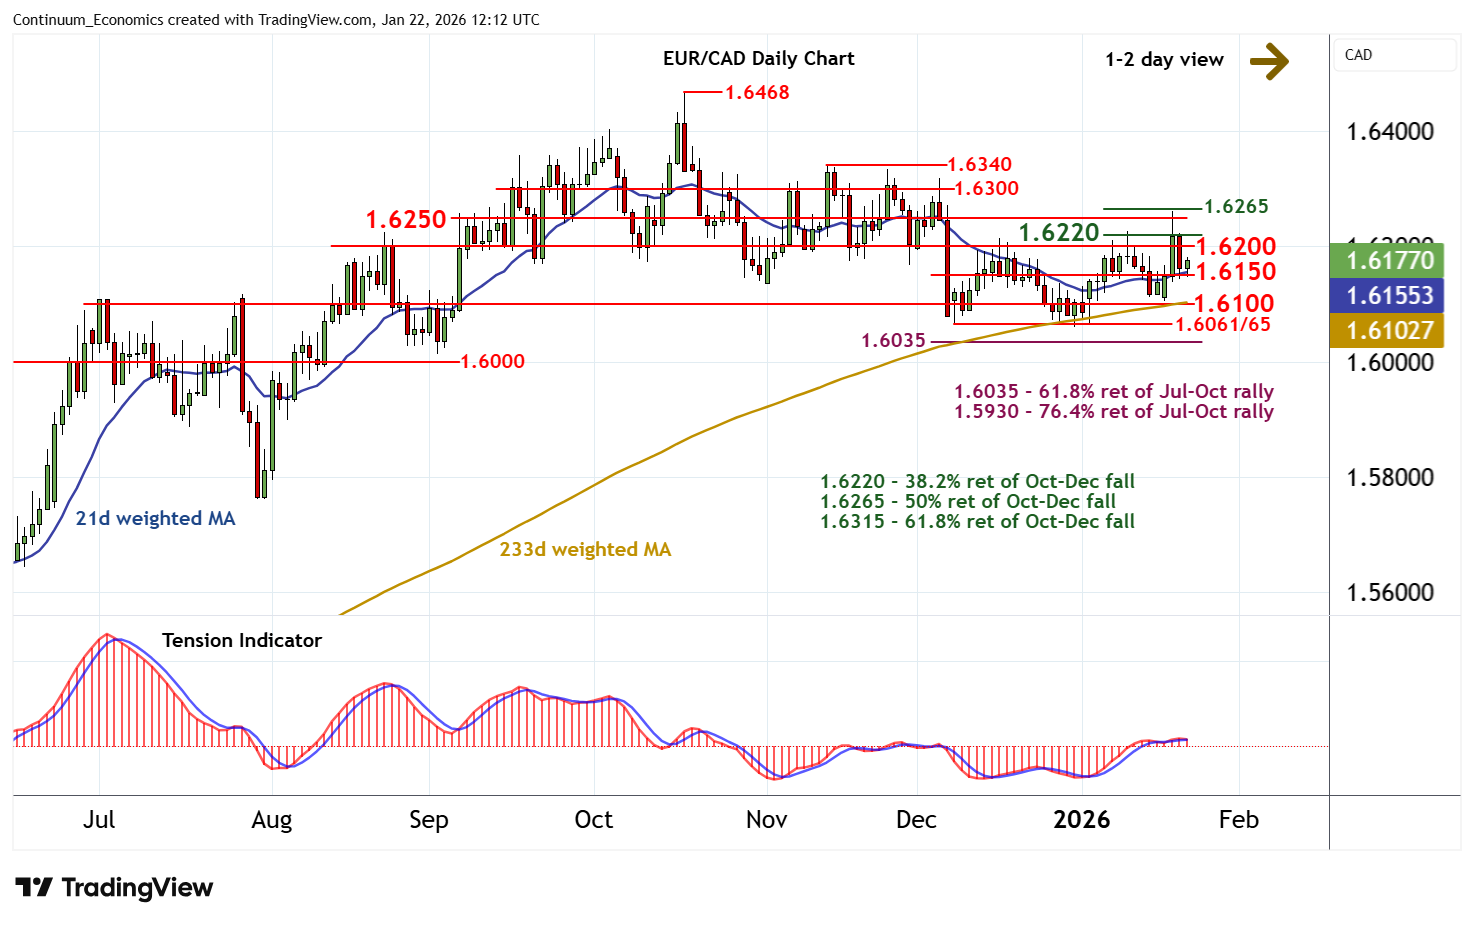
Chart EUR/CAD Update: Cautious trade
The anticipated test of congestion support at 1.6150 has bounced
| Level | Comment | Level | Comment | |||||
|---|---|---|---|---|---|---|---|---|
| R4 | 1.6265 | * | 50% ret of Oct-Dec fall | S1 | 1.6150 | * | congestion | |
| R3 | 1.6250 | break level | S2 | 1.6100 | * | congestion | ||
| R2 | 1.6220 | * | 38.2% ret of Oct-Dec fall | S3 | 1.6061/65 | * | 8-31 Dec (m) lows | |
| R1 | 1.6200 | * | congestion | S4 | 1.6035 | ** | 61.8% ret of Jul-Oct rally |
Asterisk denotes strength
11:50 GMT - The anticipated test of congestion support at 1.6150 has bounced, as oversold intraday studies turn higher, with prices currently trading around 1.6170. Focus is turning back to resistance at congestion around 1.6200 and the 1.6220 Fibonacci retracement. But deteriorating daily readings should limit any initial tests in consolidation. Broader weekly charts are rising, pointing to room for a later break above the 1.6220 Fibonacci retracement towards 1.6250/65. However, negative longer-term charts are expected to limit any tests in profit-taking/consolidation. Meanwhile, any immediate tests below 1.6150 should give way to consolidation above further congestion around 1.6100.