Published: 2026-03-30T05:34:34.000Z
Chart USD/INR Update: Lower in consolidation from 94.8400 historic high
1
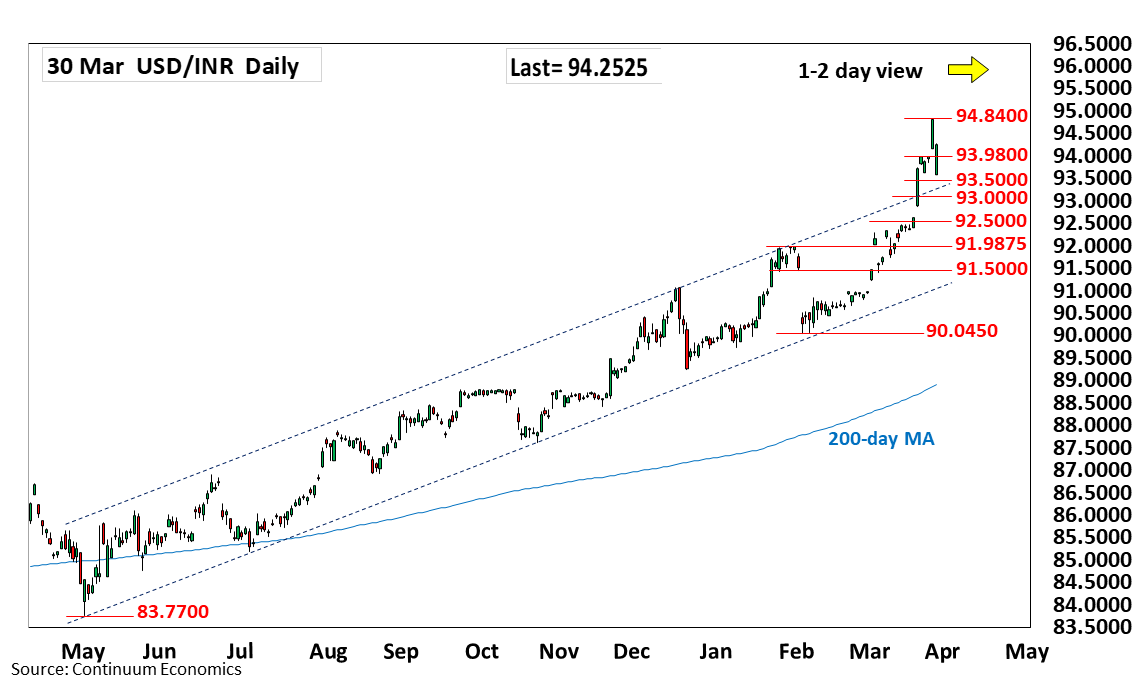
Lower at the open as prices settled back from the 94.8400 historic high
| Level | Comment | Level | Comment | |||||
|---|---|---|---|---|---|---|---|---|
| R4 | 95.0000 | * | figure | S1 | 93.5000 | congestion | ||
| R3 | 94.9900 | * | projection | S2 | 93.0000 | figure | ||
| R2 | 94.8400 | ** | 27 Mar all-time high | S3 | 92.8800 | * | 20 Mar low | |
| R1 | 94.2825 | 30 Mar intraday high | S4 | 92.5000 | * | congestion |
Asterisk denotes strength of level
05:30 GMT - Lower at the open as prices settled back from the 94.8400 historic high to consolidate sharp gains from the 90.0450, February low. Pullback see prices unwinding the deep overbought daily and weekly studies below the 94.0000 level to support at the 93.6350/93.5000 area. Below this will ease the upside pressure and see room for pullback to consolidate at the 93.0000/92.8800 congestion and 20 March low. Meanwhile, resistance is at the 94.2825 intraday high ahead of Friday's 94.8400 historic high. Clearance here will see room to the 95.0000 figure.