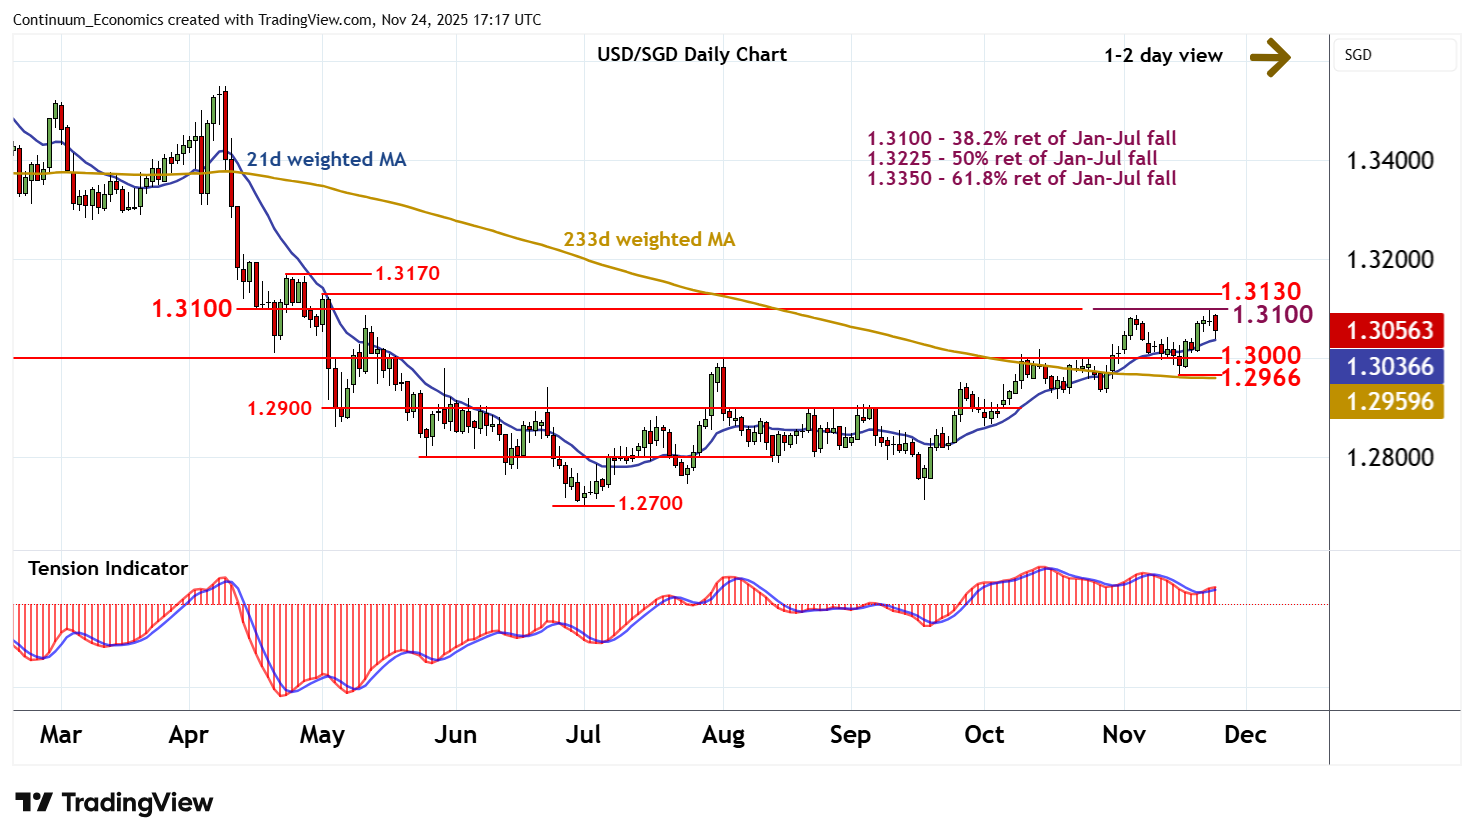
Chart USD/SGD Update: Lower in range
The test of strong resistance at the 1.3100 Fibonacci retracement is giving way to a pullback
| Level | Comment | Level | Comment | ||||
|---|---|---|---|---|---|---|---|
| R4 | 1.3225 | ** | 50% ret of Jan-Jul fall | S1 | 1.3000 | * | Aug high, break |
| R3 | 1.3170/00 | * | 23 Apr high, congestion | S2 | 1.2966 | ** | 14 Nov (w) low |
| R2 | 1.3130 | * | May high | S3 | 1.2950 | * | Sep high |
| R1 | 1.3100 | * | 38.2% ret of Jan-Jul fall | S4 | 1.2917/00 | ** | 17 Oct low, congestion |
Asterisk denotes strength of level
17:10 GMT - The test of strong resistance at the 1.3100 Fibonacci retracement is giving way to a pullback, as intraday studies turn down, with prices currently balanced around 1.3050. Positive daily readings are flattening, suggesting room for continuation down to support at 1.3000. But mixed weekly charts are expected to limit any immediate tests beneath here in consolidation above the 1.2966 weekly low of 14 November. A close beneath here would add weight to sentiment and extend losses towards 1.2900/17. Meanwhile, a close above 1.3100, if seen, will turn sentiment positive and extend July gains beyond the 1.3130 high of May towards 1.3170/00.