Published: 2026-02-02T03:07:31.000Z
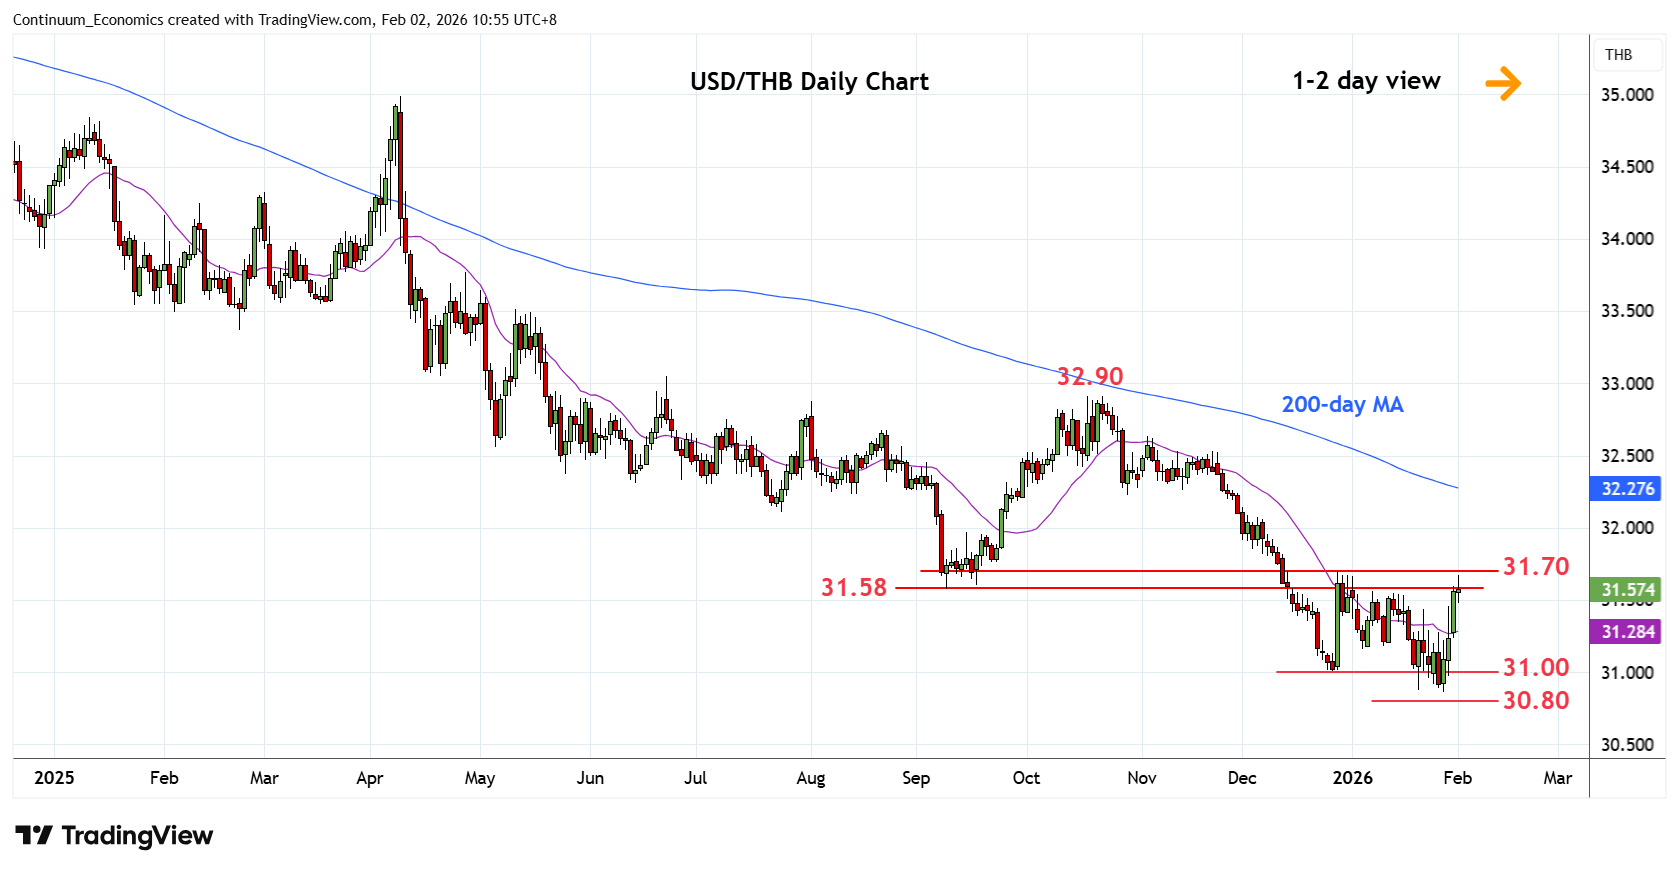
Chart USD/THB Update: Extend bounce from 30.86 low
-
Extend bounce from the 30.86 low of last week to retrace all of the January to retest strong resistance at the 31.58/31.70 area
| Level | Comment | Level | Comment | |||||
|---|---|---|---|---|---|---|---|---|
| R4 | 32.00 | * | congestion | S1 | 31.16 | * | 6 Jan low | |
| R3 | 31.88 | * | 50% Oct/Jan fall | S2 | 31.00 | * | Dec low | |
| R2 | 31.80 | congestion | S3 | 30.86 | ** | 28 Jan YTD low | ||
| R1 | 31.58/70 | ** | Sep low, 18 Dec high | S4 | 30.80 | * | Jun 2020 low |
Asterisk denotes strength of level
03:00 GMT - Extend bounce from the 30.86 low of last week to retrace all of the January losses to retest strong resistance at the 31.58/31.70 area. Daily and weekly studies are unwinding oversold reading and suggest scope for break here to open up room for strong gains to retrace the October/Janyary losses. Higher will see room to 31.80 congestion and 31.88, 50% Fibonacci level. Meanwhile, support is raised to 31.20/31.16 area which should now underpin. Would take break here to return focus to the downside for retest of the 31.00 and 30.86 lows.