Published: 2026-02-26T02:44:33.000Z
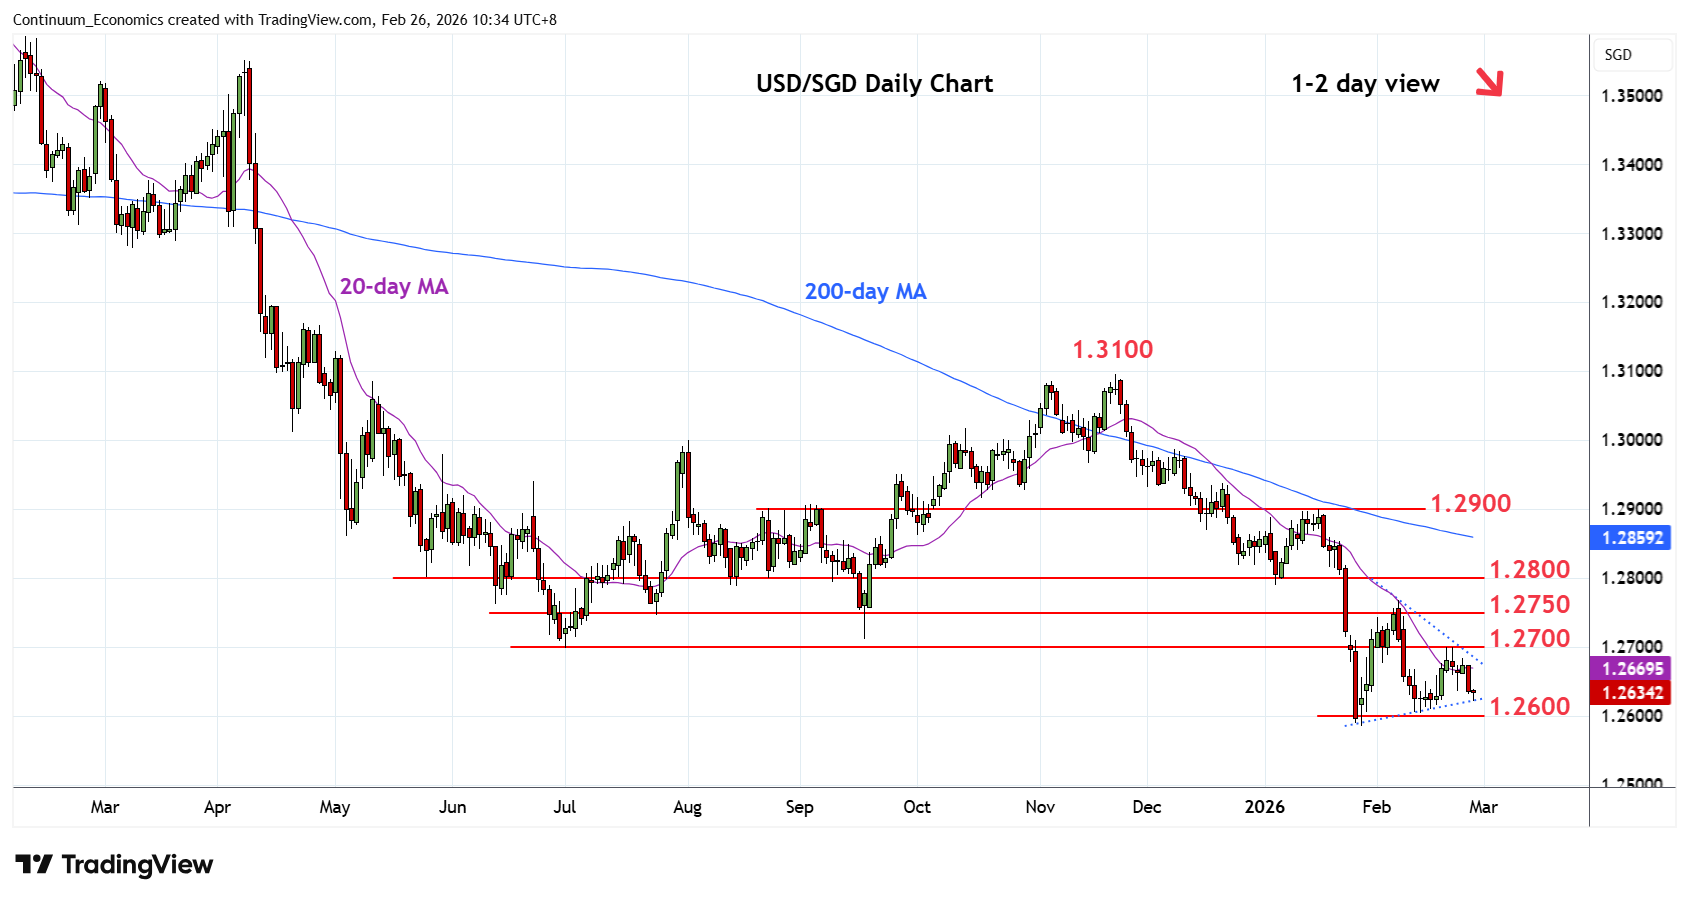
Chart USD/SGD Update: Focus return to 1.2600/1.2586 lows
1
Extending rejection from the 1.2700 resistance with break of 1.2635 Monday's low returning focus to the 1.2600 level and 1.2586 low
| Level | Comment | Level | Comment | ||||
|---|---|---|---|---|---|---|---|
| R4 | 1.2800 | ** | congestion | S1 | 1.2600 | * | congestion |
| R3 | 1.2780 | * | 38.2% Nov/Jan fall | S2 | 1.2586 | ** | 28 Jan YTD low |
| R2 | 1.2768 | ** | 6 Feb high | S3 | 1.2550 | * | congestion |
| R1 | 1.2700 | * | congestion | S4 | 1.2500 | * | congestion |
Asterisk denotes strength of level
02:35 GMT - Extending rejection from the 1.2700 resistance with break of 1.2635 Monday's low returning focus to the 1.2600 level and 1.2586, 28 January current year low. Consolidation above the latter see prices tracing out a broad 4-week triangle pattern and break of these will extend the November losses from the 1.3100 high. Lower will extend the broader losses from the 2020 year high and see extension to the 1.2550/1.2500 congestion area. Meanwhile, resistance at the 1.2700 level is expected to cap and sustain losses from the 1.2768, 6 February swing high.