Published: 2026-05-12T04:32:41.000Z
Chart USD/IDR Updates: Break to fresh historic high
10
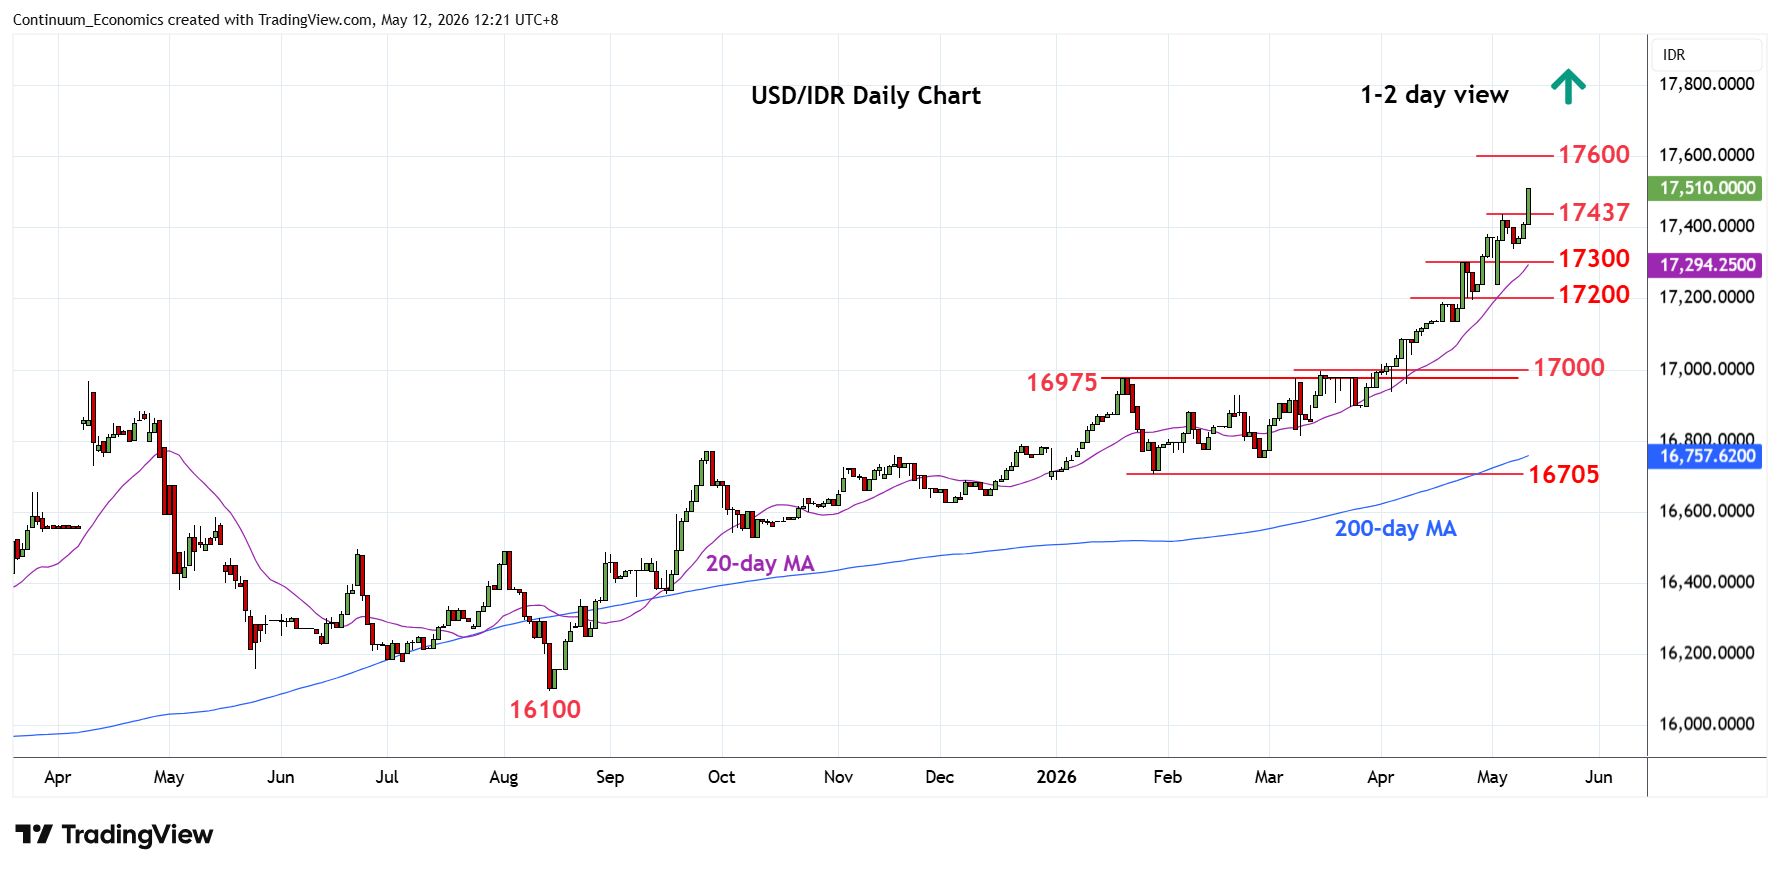
Consolidation below the 17437 high of 5 May has given way to break to reach fresh historic high at 17510
| Levels | Imp | Comment | Levels | Imp | Comment | |||
|---|---|---|---|---|---|---|---|---|
| R4 | 18000 | figure | S1 | 17437 | * | 5 May high | ||
| R3 | 17800 | projection | S2 | 17300 | * | 23 Apr high | ||
| R2 | 17600 | projection | S3 | 17240/200 | * | 4 May low, congestion | ||
| R1 | 17510 | intraday high | S4 | 17100/090 | ** | congestion, 7 Apr high |
Asterisk denotes strength of level
04:30 GMT - Consolidation below the 17437 high of 5 May has given way to break to reach fresh historic high at 17510. Bullish momentum from suggest room to further extend parabolic gains from the 16705 January year low to 17600 and 17800 projection targets. However, overbought daily and weekly studies caution corrective pullback with support now raised to the 17437/17400 area. Break here will open up room for deeper corrective pullback to support at the 17300 congestion and 17240/17200 area.