Published: 2026-03-09T06:12:23.000Z
Chart USD/IDR Updates: Retest 16975 high
5
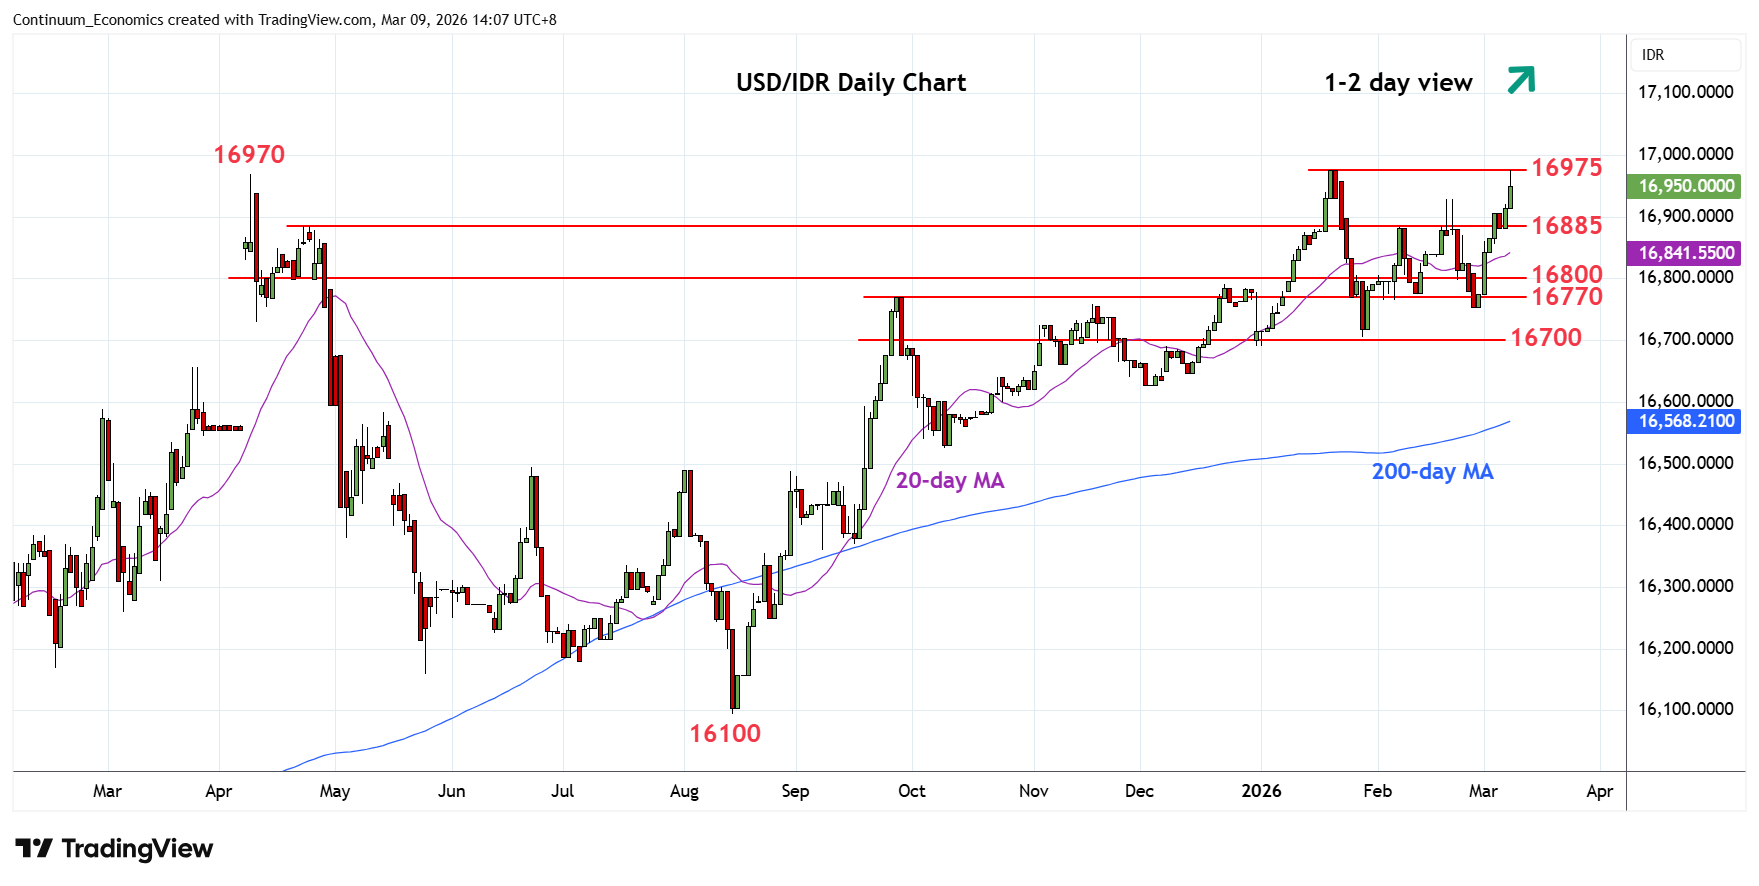
Consolidation at the 16900 level has given way to break to retest the 16975, January all-time high
| Levels | Imp | Comment | Levels | Imp | Comment | |||
|---|---|---|---|---|---|---|---|---|
| R4 | 17270 | extension | S1 | 16885 | * | congestion | ||
| R3 | 17200 | projection | S2 | 16800 | * | congestion | ||
| R2 | 17000 | ** | figure | S3 | 16755 | ** | Feb low | |
| R1 | 16975 | ** | 20 Jan all-time high | S4 | 16705 | ** | 28 Jan YTD low |
Asterisk denotes strength of level
06:10 GMT - Consolidation at the 16900 level has given way to break to retest the 16975, January all-time high. Prices has since settled back in consolidation to unwind overbought intraday studies but a later break cannot be ruled out. Beyond this will open up room for further extension to the 17000/17200 area where reaction can be expected. Meanwhile, support at the 16855/16800 congestion should underpin. Only below here will expose critical support at 16755 and 16705 lows to retest. Would take break of these to see deeper correction of gains from the August low.