Published: 2025-10-15T05:19:06.000Z
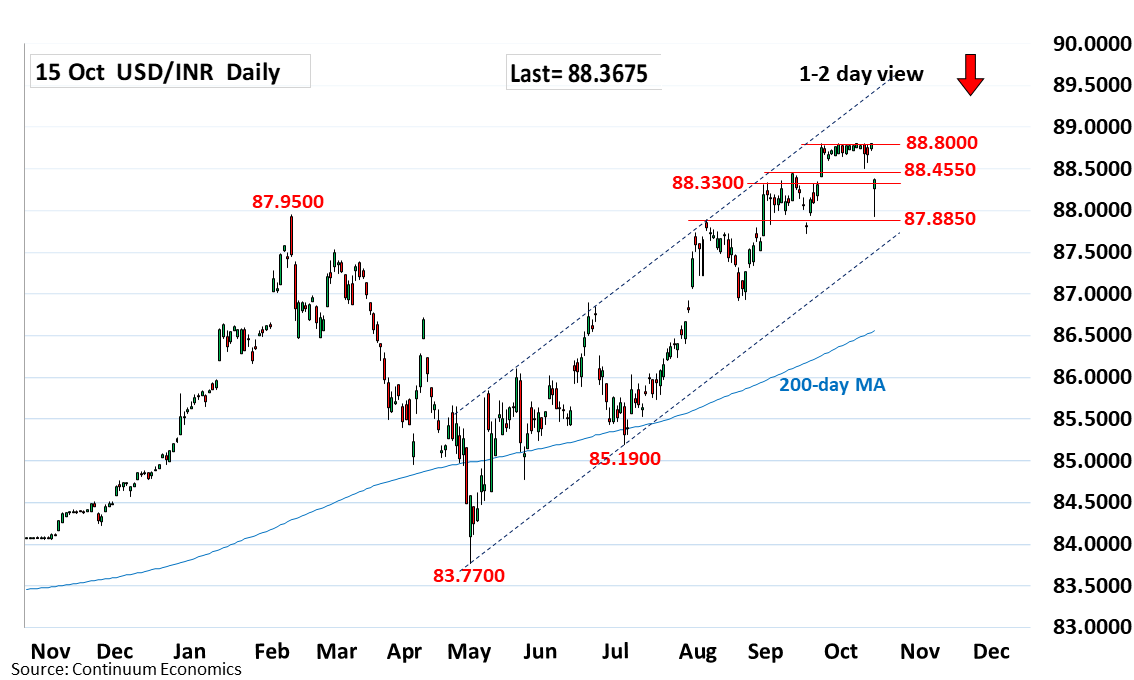
Chart USD/INR Update: Sharp pullback from 88.8000 high
1
Gapped down at the open below the 88.5000 low of last week as prices turn sharply lower from the 88.8000 all-time high
| Level | Comment | Level | Comment | |||||
|---|---|---|---|---|---|---|---|---|
| R4 | 89.0000 | * | figure | S1 | 88.0000 | * | congestion | |
| R3 | 88.8000 | ** | 30 Sep all-time high | S2 | 87.8850 | ** | 5 Aug high | |
| R2 | 88.5000 | ** | 10 Oct low | S3 | 87.8600 | * | Sep low | |
| R1 | 88.4550 | * | Sep high | S4 | 87.5000 | * | congestion |
Asterisk denotes strength of level
05:10 GMT - Gapped down at the open below the 88.5000 low of last week as prices turn sharply lower from the 88.8000 all-time high. Pullback reached the 88.0000/87.8850 support before turning higher to consolidate sharp losses. However, negative daily studies suggest consolidation giving way to fresh selling pressure later and see deeper pullback to retrace strong gains from the 85.1900, July low. Lower will see room to 87.8600 September annd 87.5000 congestion. Resistance is lowered to 88.4500/88.5000 area now expected to cap and sustain losses from the 88.8000 high.