Published: 2026-01-08T05:02:19.000Z
Chart USD/INR Update: Extending pullback from 90.2900 corrective high
1
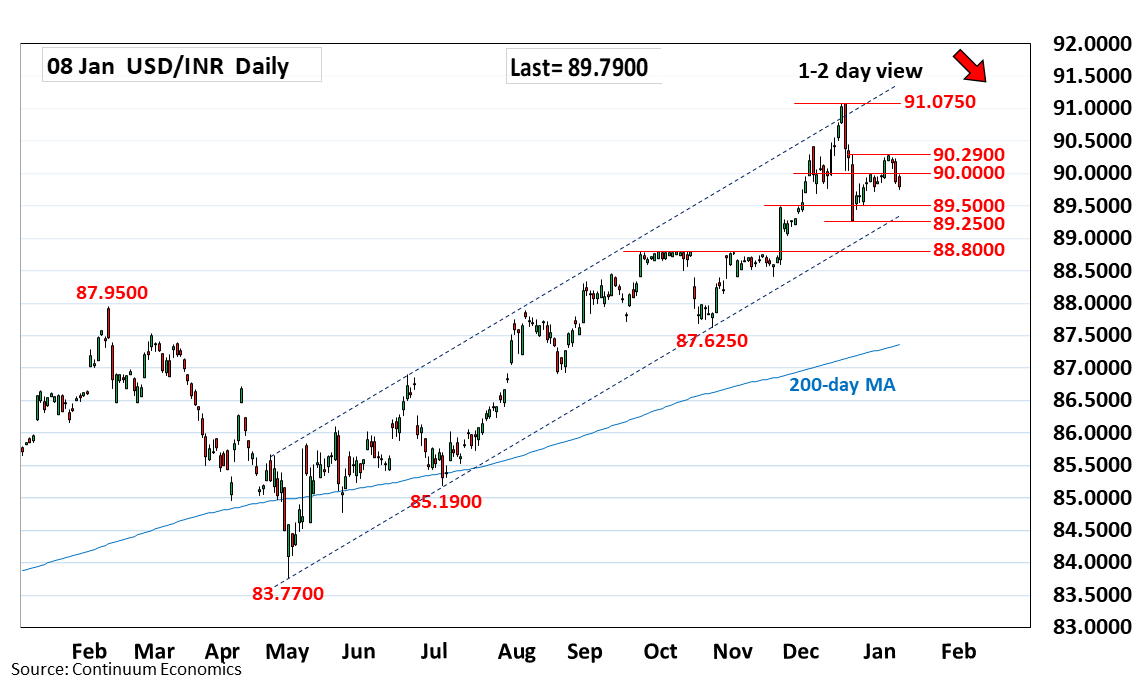
Under pressure as prices extend pullback from the 90.2900 corrective high to retrace bounce from the 89.2500 December low
| Level | Comment | Level | Comment | |||||
|---|---|---|---|---|---|---|---|---|
| R4 | 90.5000 | * | congestion | S1 | 89.7200 | * | 30 Dec low | |
| R3 | 90.4200 | * | 4 Dec high | S2 | 89.5000 | * | congestion | |
| R2 | 90.2900 | ** | 5 Jan high | S3 | 89.2500 | ** | Dec low | |
| R1 | 90.0000 | * | figure, congestion | S4 | 89.0000 | figure |
Asterisk denotes strength of level
05:00 GMT - Under pressure as prices extend pullback from the 90.2900 corrective high to retrace bounce from the 89.2500 December low. Pullback see nearby support at 89.7200 then the 89.5000 congestion. Below these will return focus to the 89.2500 low and where break will open up room for deeper pullback to retrace gains from the 83.7700 May low to the 89.0000 figure and strong support at 88.8000, September high. Meanwhile, resistance is lowered to 90.0000 figure, now expected to cap and sustain losses from the 90.2900, 5 January high.