Published: 2026-03-27T05:03:05.000Z
Chart USD/INR Update: Break to fresh all-time high above 94.0000
1
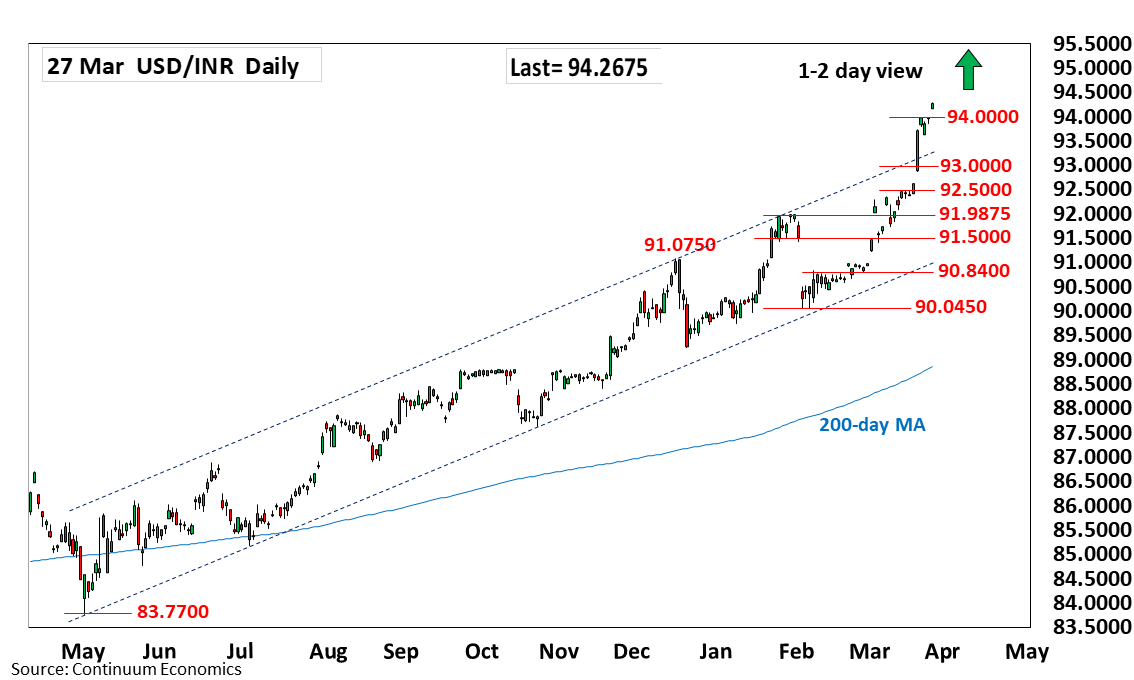
Consolidation has given way to break to fresh all-time high above the 94.0000 level
| Level | Comment | Level | Comment | |||||
|---|---|---|---|---|---|---|---|---|
| R4 | 95.0000 | * | figure | S1 | 93.6350 | * | 24 Mar low | |
| R3 | 94.9900 | * | projection | S2 | 93.0000 | figure | ||
| R2 | 94.5000 | * | projection | S3 | 92.8800 | * | 20 Mar low | |
| R1 | 94.2950 | intraday high | S4 | 92.5000 | * | congestion |
Asterisk denotes strength of level
05:00 GMT - Consolidation has given way to break to fresh all-time high above the 94.0000 level as gains takes on parabolic trajectory to extend gains from the 90.0450, February low. Break above the 94.0000 figure see room to further extend the underlying bull trend to 94.5000 projection target. However, deep overbought daily and weekly studies caution corrective pullback with support starting at 93.6350 low of Tuesday which now underpin. Below this needed to ease the upside pressure and see room for pullback to consolidate at the 93.0000/92.8800 congestion and 20 March low.