Published: 2026-04-15T04:35:08.000Z
Chart USD/IDR Updates: Extending gains, but stretched
4
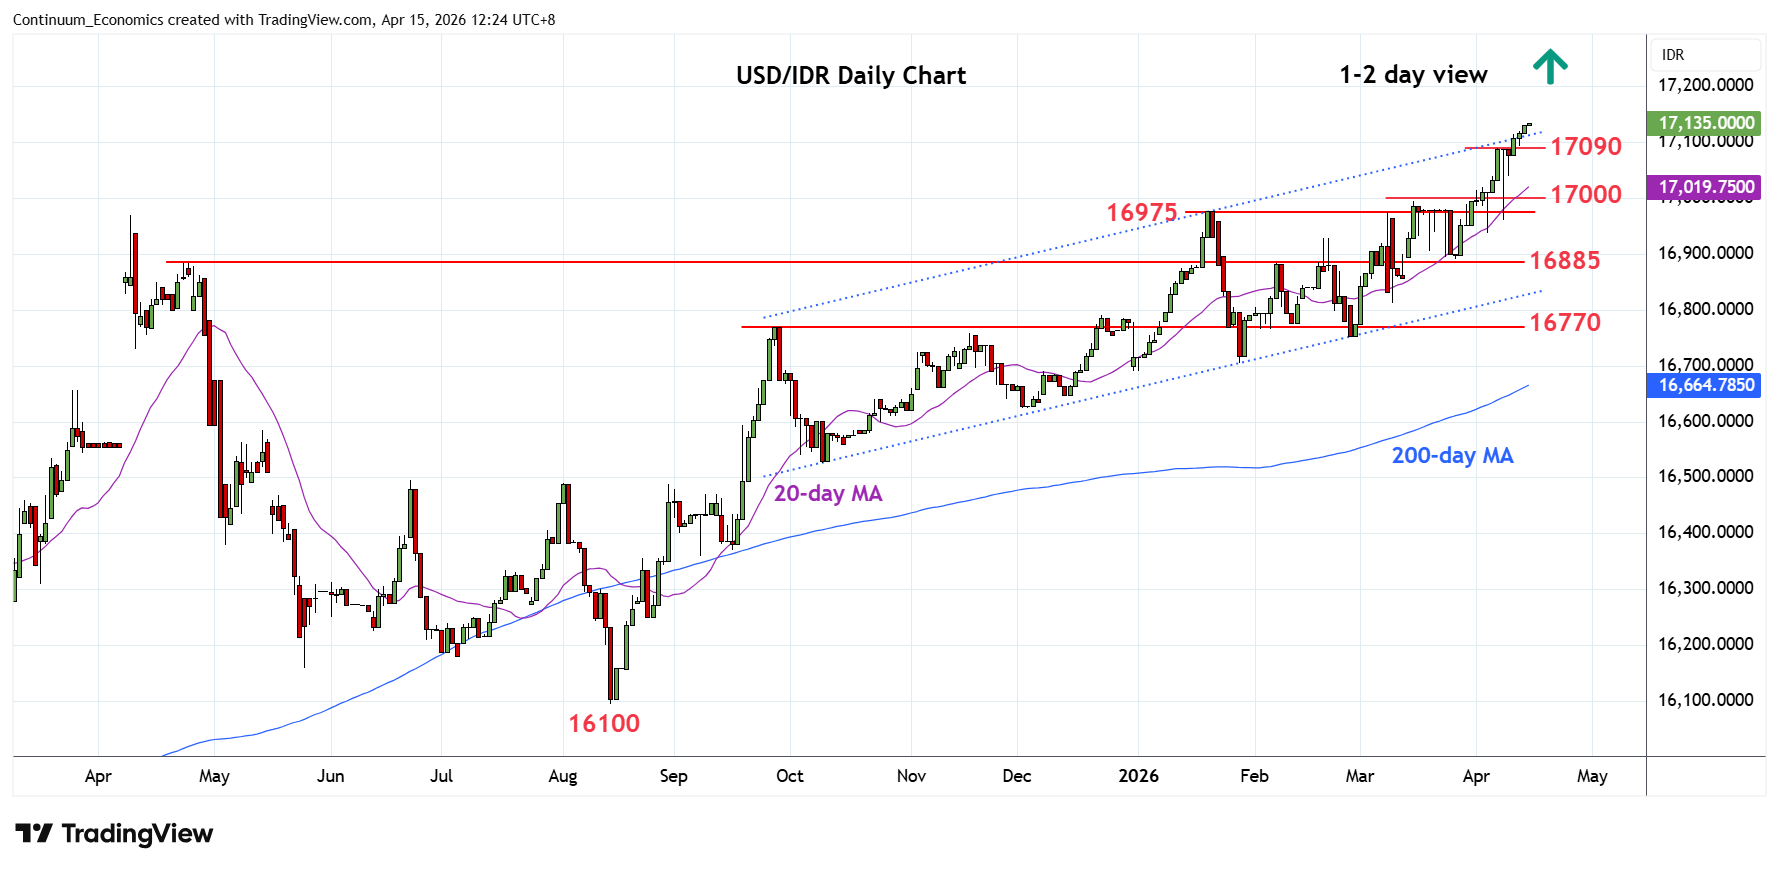
Still pressuring the upside with gains edging to fresh all-time high at 17135
| Levels | Imp | Comment | Levels | Imp | Comment | |||
|---|---|---|---|---|---|---|---|---|
| R4 | 18000 | figure | S1 | 17040 | * | 9 Apr low | ||
| R3 | 17600 | projection | S2 | 16995/75 | ** | Mar, Jan highs | ||
| R2 | 17200 | projection | S3 | 16885 | ** | congestion | ||
| R1 | 17135 | intraday high | S4 | 16800 | * | congestion |
Asterisk denotes strength of level
04:30 GMT - Still pressuring the upside with gains edging to fresh all-time high at 17135. Nearby see scope for extension to target the 17200/17400 projection area but bullish momentum slows as daily and weekly studies stretches into overbought areas and caution corrective pullback. Meanwhille, support is raised to the 17040 ahead of the 16995/16975 recent March and January highs which should underpin. Would take break here to fade the upside pressure and open up room for deeper corrective pullback to strong support at the 16900/16885 congestion area.