Published: 2026-01-23T05:39:15.000Z
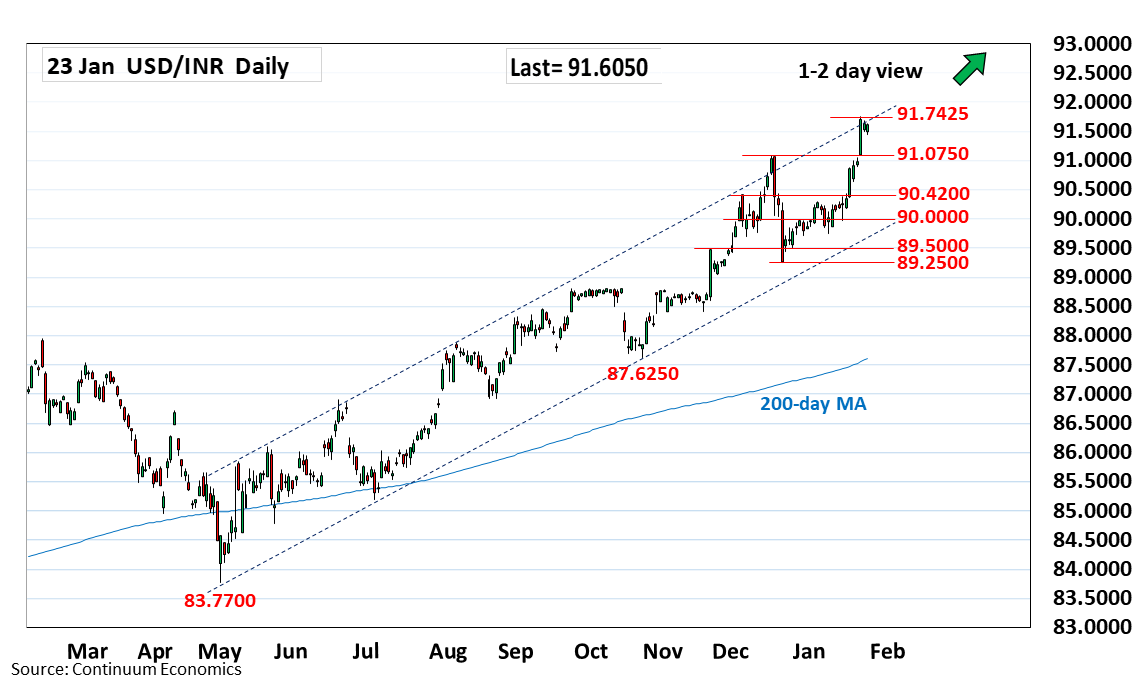
Chart USD/INR Update: Drift lower in consolidation
-
Settling back from the 91.7425 high as prices consolidate strong gains from the 89.2500 December low
| Level | Comment | Level | Comment | |||||
|---|---|---|---|---|---|---|---|---|
| R4 | 92.6500 | * | projection | S1 | 91.0000 | * | figure | |
| R3 | 92.1300 | * | projection | S2 | 90.4200 | * | 4 Dec high | |
| R2 | 92.0000 | * | figure | S3 | 90.2900 | ** | 5 Jan high | |
| R1 | 91.7425 | * | 21 Jan all-time high | S4 | 90.0000 | ** | congestion |
Asterisk denotes strength of level
05:30 GMT - Settling back from the 91.7425 high as prices consolidate strong gains from the 89.2500 December low and unwind overbought intraday and daily studies. However, further gains not ruled out to extend the underlying bull trend. Higher, if seen, will see room to the 92.0000 level and 92.1300 projection target. Meanwhile, support is at the 91.0750/91.0000 area which is expected to underpin. Would take break here to fade the upside pressure and see room for deeper pullback to retrace strong gains from the December low to 90.4200/90.2900 area.