Published: 2026-03-13T03:33:37.000Z
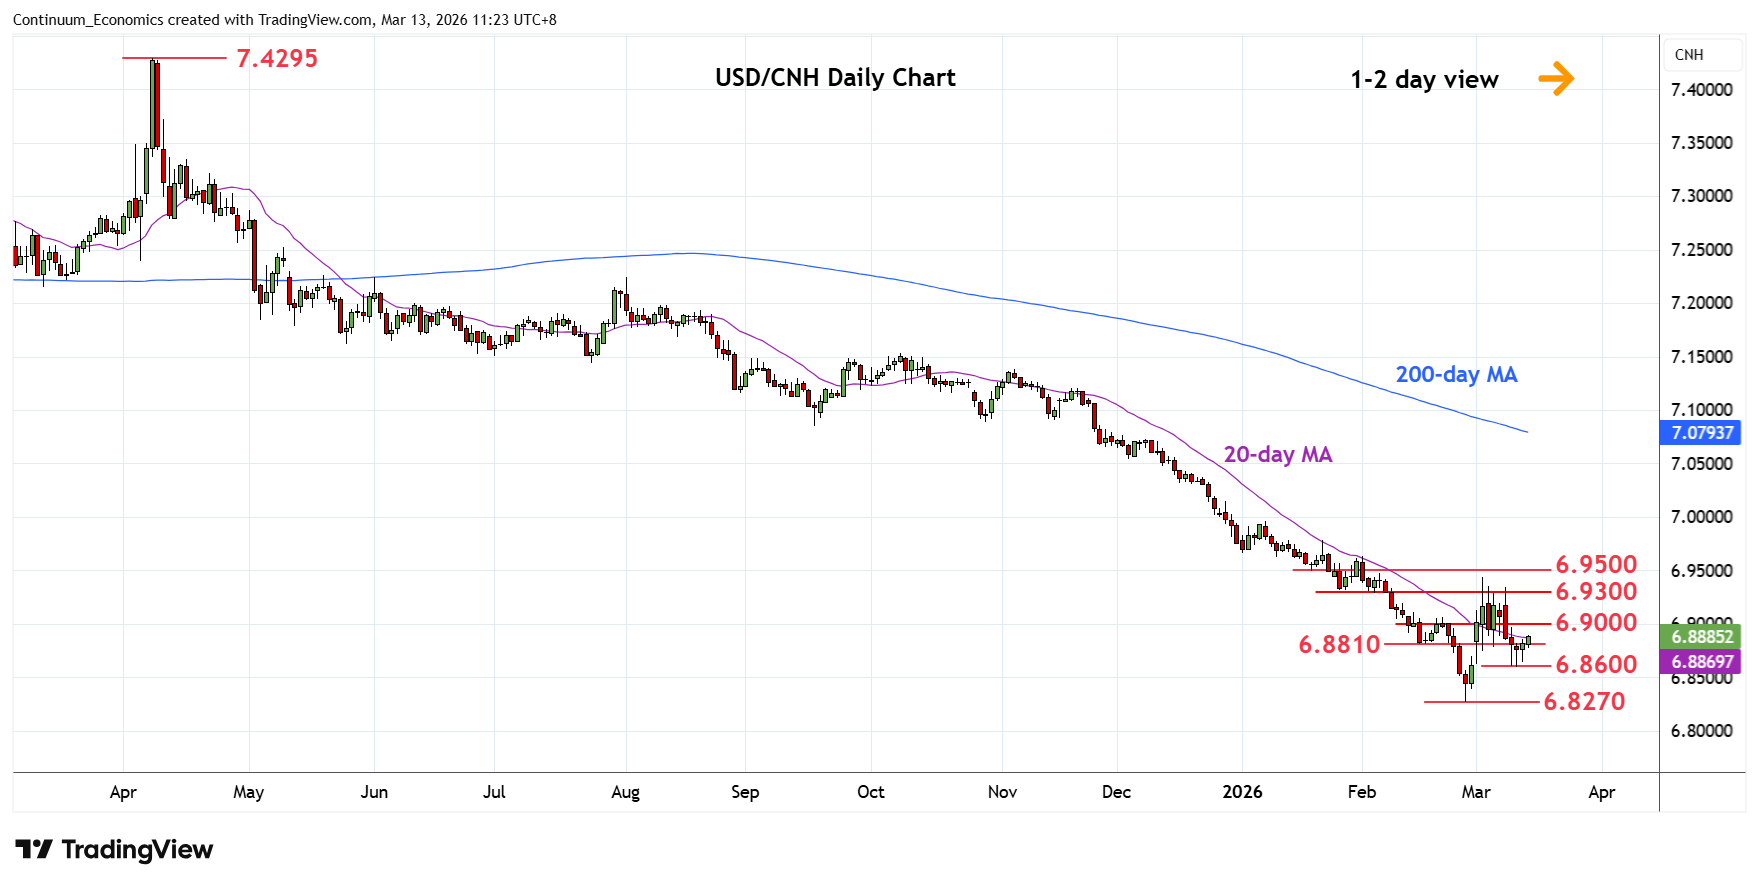
Chart USD/CNH Update: Higher in consolidation from 6.8600 low
-
Turned up from the 6.8600 low as prices consolidate rejection from resistance at the 6.9300/6.9500 area
| Level | Imp | Comment | Level | Imp | Comment | |||
|---|---|---|---|---|---|---|---|---|
| R4 | 6.9700 | * | 2024 year low | S1 | 6.8600 | * | 11 Mar low | |
| R3 | 6.9500 | * | congestion, 38.2% | S2 | 6.8270 | ** | 26 Feb YTD low | |
| R2 | 6.9300 | ** | Jan low, congestion | S3 | 6.8100 | * | Mar 2023 low | |
| R1 | 6.9000 | * | congestion | S4 | 6.8000 | * | congestion |
Asterisk denotes strength of level
03:30 GMT - Turned up from the 6.8600 low as prices consolidate rejection from resistance at the 6.9300/6.9500 area. Daily and weekly studies have turned up from oversold areas and suggest scope for stronger bounce to the 6.9000 level. Clearance here will ease the downside pressure and open up room for retest of resistance at the 6.9300/6.9500 area. Above here will see room for stronger gains to retrace losses from the April high to resistance at the 6.9700, 2024 year low. Meanwhile, support at the 6.8800/6.8600 area should underpin.