Published: 2026-05-04T05:53:09.000Z
Chart USD/IDR Updates: Lower in consolidation from historic high
1
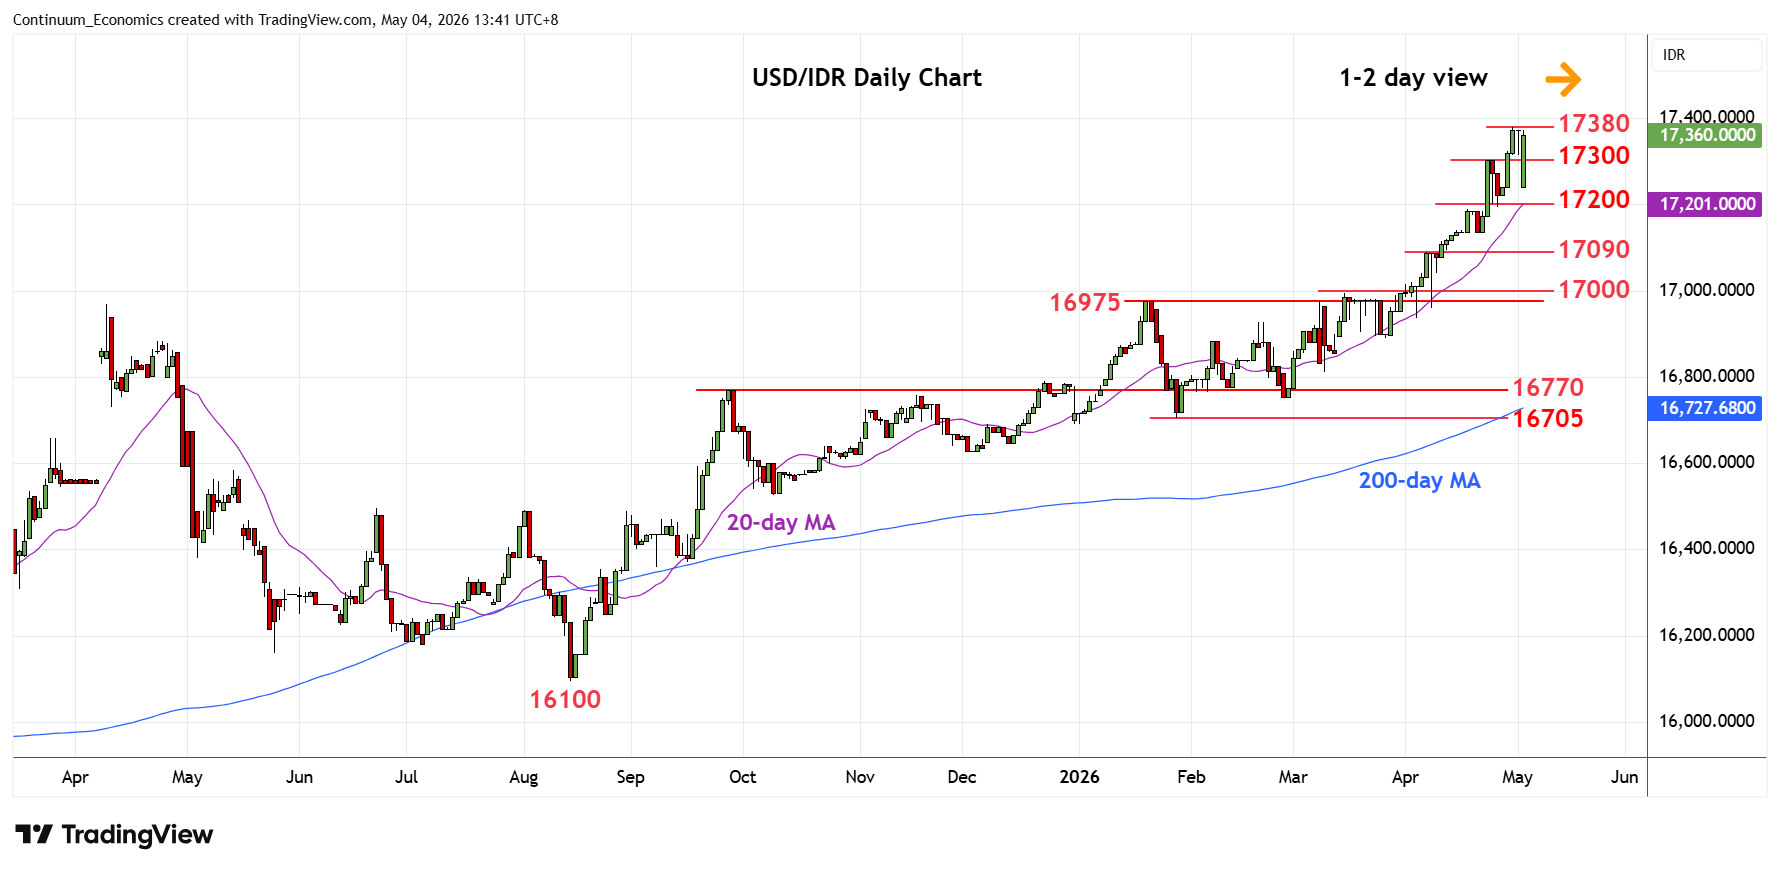
Settled back in consolidation from the 17380 historic high as prices unwind overbought daily studies
| Levels | Imp | Comment | Levels | Imp | Comment | |||
|---|---|---|---|---|---|---|---|---|
| R4 | 18000 | figure | S1 | 17200 | * | congestion | ||
| R3 | 17600 | projection | S2 | 17137 | 17 Apr low | |||
| R2 | 17500 | projection | S3 | 17100/090 | ** | congestion, 7 Apr high | ||
| R1 | 17380 | ** | 30 Apr all-time high | S4 | 17000 | ** | figure, congestion |
Asterisk denotes strength of level
05:45 GMT - Settled back in consolidation from the 17380 historic high as prices unwind overbought daily studies. Further gains cannot be ruled out to extend bullish gains from the January low. Higher will see room for extension to the 17500 and 17600 projection targets. However, deep overbought daily and weekly studies caution corrective pullback to support at the 17200 low of last week. Below here will open up room for deeper corrective pullback to 17137 support and 17100/17090 congestion and 7 April high.