Published: 2026-02-02T04:52:07.000Z
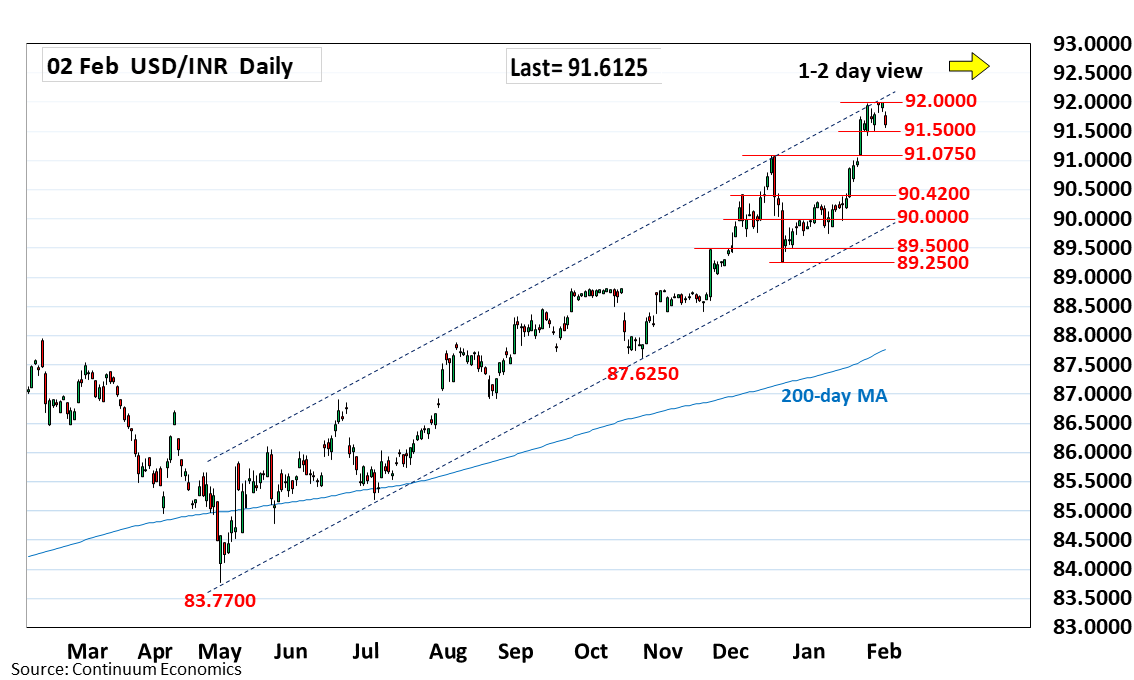
Chart USD/INR Update: Leaning lower from 91.9875 historic high
-
Turned lower from the Friday's 91.9875 historic high as prices consolidate gains from the 89.2500, December low
| Level | Comment | Level | Comment | |||||
|---|---|---|---|---|---|---|---|---|
| R4 | 92.6500 | * | projection | S1 | 91.5000 | * | congestion | |
| R3 | 92.1300 | * | projection | S2 | 91.0000 | * | figure | |
| R2 | 92.0000 | ** | figure | S3 | 90.4200 | * | 4 Dec high | |
| R1 | 91.9875 | ** | 30 Jan all-time high | S4 | 90.2900 | ** | 5 Jan high |
Asterisk denotes strength of level
04:45 GMT - Turned lower from the Friday's 91.9875 historic high as prices consolidate gains from the 89.2500, December low. Pullback see support starting at the 91.5000/91.9450 congestion area but negative daily studies and overbought weekly chart highlight risk for break here to open up room for deeper pullback to support at the 91.0750/91.0000 area. Break of the latter will turn focus lower and see correction to the 90.5000/90.4200 area. Meanwhile, resistance at 91.9650/91.9875 highs are expected to cap.