Published: 2026-05-06T05:05:24.000Z
Chart USD/INR Update: Lower in consolidation
1
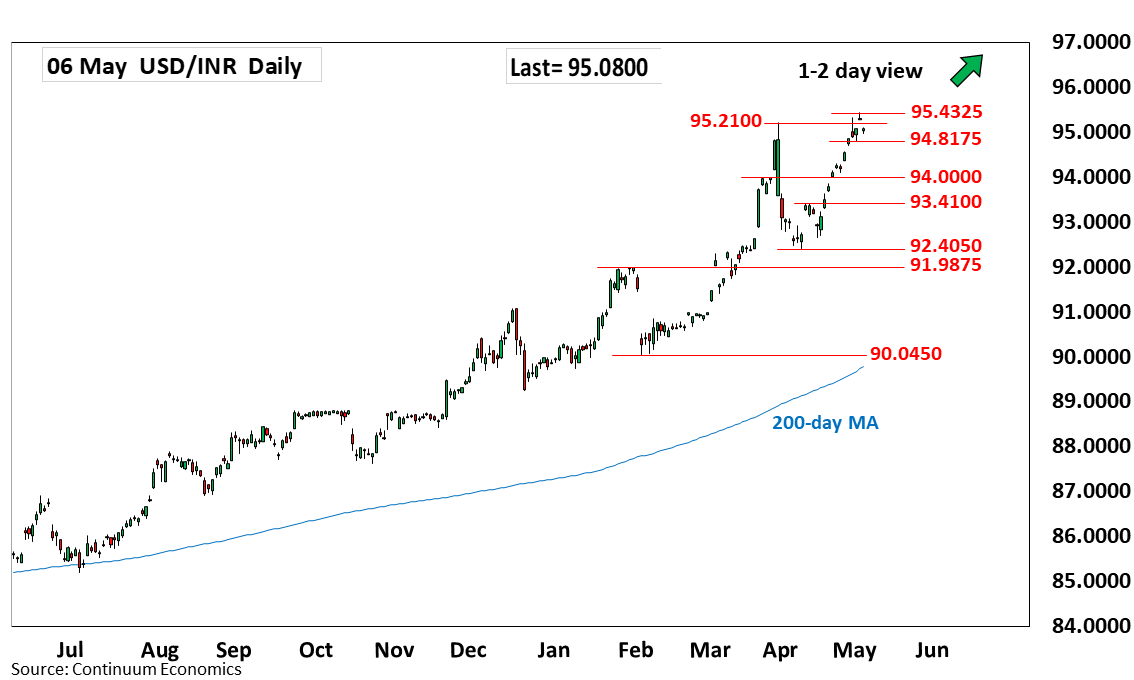
Gapped down at the open see prices consolidating strong gains from the 92.4050, 10 April low
| Level | Comment | Level | Comment | |||||
|---|---|---|---|---|---|---|---|---|
| R4 | 96.1000 | projection | S1 | 94.8175 | * | 4 May low | ||
| R3 | 96.0000 | figure | S2 | 94.3050 | * | 24 Apr high | ||
| R2 | 95.5000 | projection | S3 | 94.0000 | ** | figure, congestion | ||
| R1 | 95.4325 | ** | 5 May all-time high | S4 | 93.4100 | ** | 15 Apr high |
Asterisk denotes strength of level
05:00 GMT - Gapped down at the open see prices consolidating strong gains from the 92.4050, 10 April low. Pullback see prices unwinding overbought intraday studies from the 95.4325 historic high. However, further gains cannot be ruled out to extend the underlying bull trend to the 95.5000 projection target. Deep overbought daily studies caution corrective and see break of support at 94.8175 needed to open up room for deeper correction to support at 94.3050 high of 24 April and the 94.0000 figure.