Published: 2026-03-16T06:03:15.000Z
Chart USD/IDR Updates: Break to fresh historic high
3
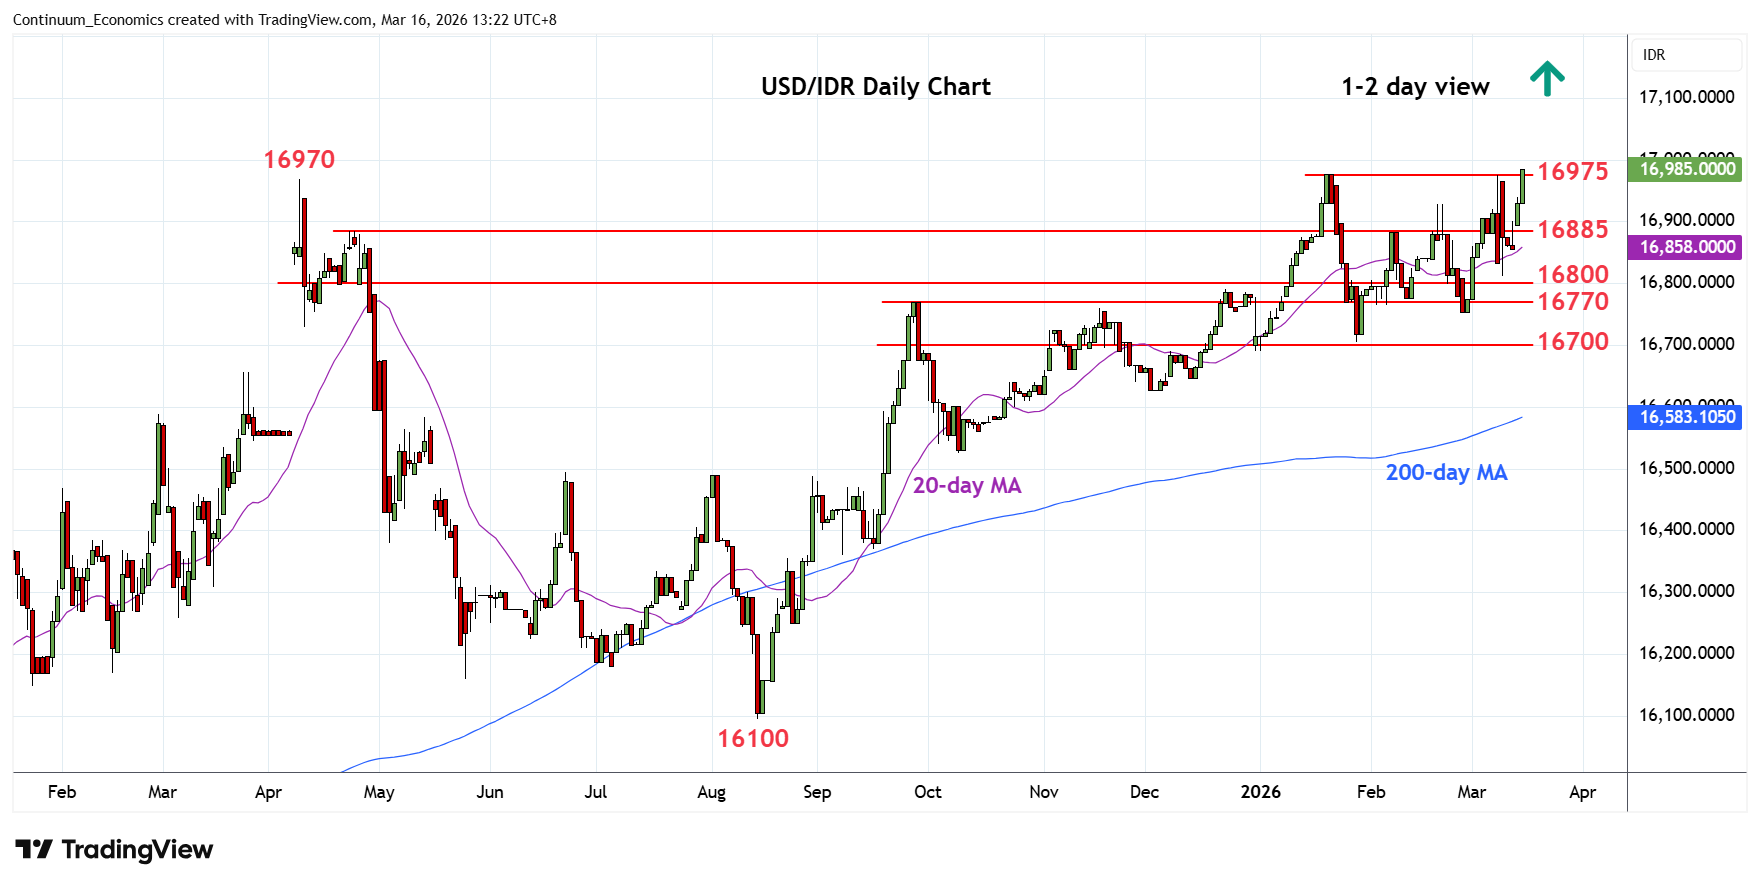
Consolidation below the 16975 January high has given way to break to extend the underlying bull trend
| Levels | Imp | Comment | Levels | Imp | Comment | |||
|---|---|---|---|---|---|---|---|---|
| R4 | 17800 | projection | S1 | 16885 | * | congestion | ||
| R3 | 17600 | projection | S2 | 16800 | * | congestion | ||
| R2 | 17200 | projection | S3 | 16755 | ** | Feb low | ||
| R1 | 17000 | ** | figure | S4 | 16705 | ** | 28 Jan YTD low |
Asterisk denotes strength of level
05:50 GMT - Consolidation below the 16975 January high has given way to break to extend the underlying bull trend and see room to target the 17000 level. Positive daily and weekly studies suggest scope for break here to open up room for extension to 17200 level. Higher still, if seen, will see room to 17600 projection target. Meanwhile, support is raised to 16900/16885 area which should now underpin. Only below here will eased the upside pressure and see room for deeper pullback to support at the 16800 congestion and the critical 16755/16705, February/January lows.