Published: 2026-03-10T05:43:41.000Z
Chart USD/IDR Updates: Settled back from retest of 16975 high
2
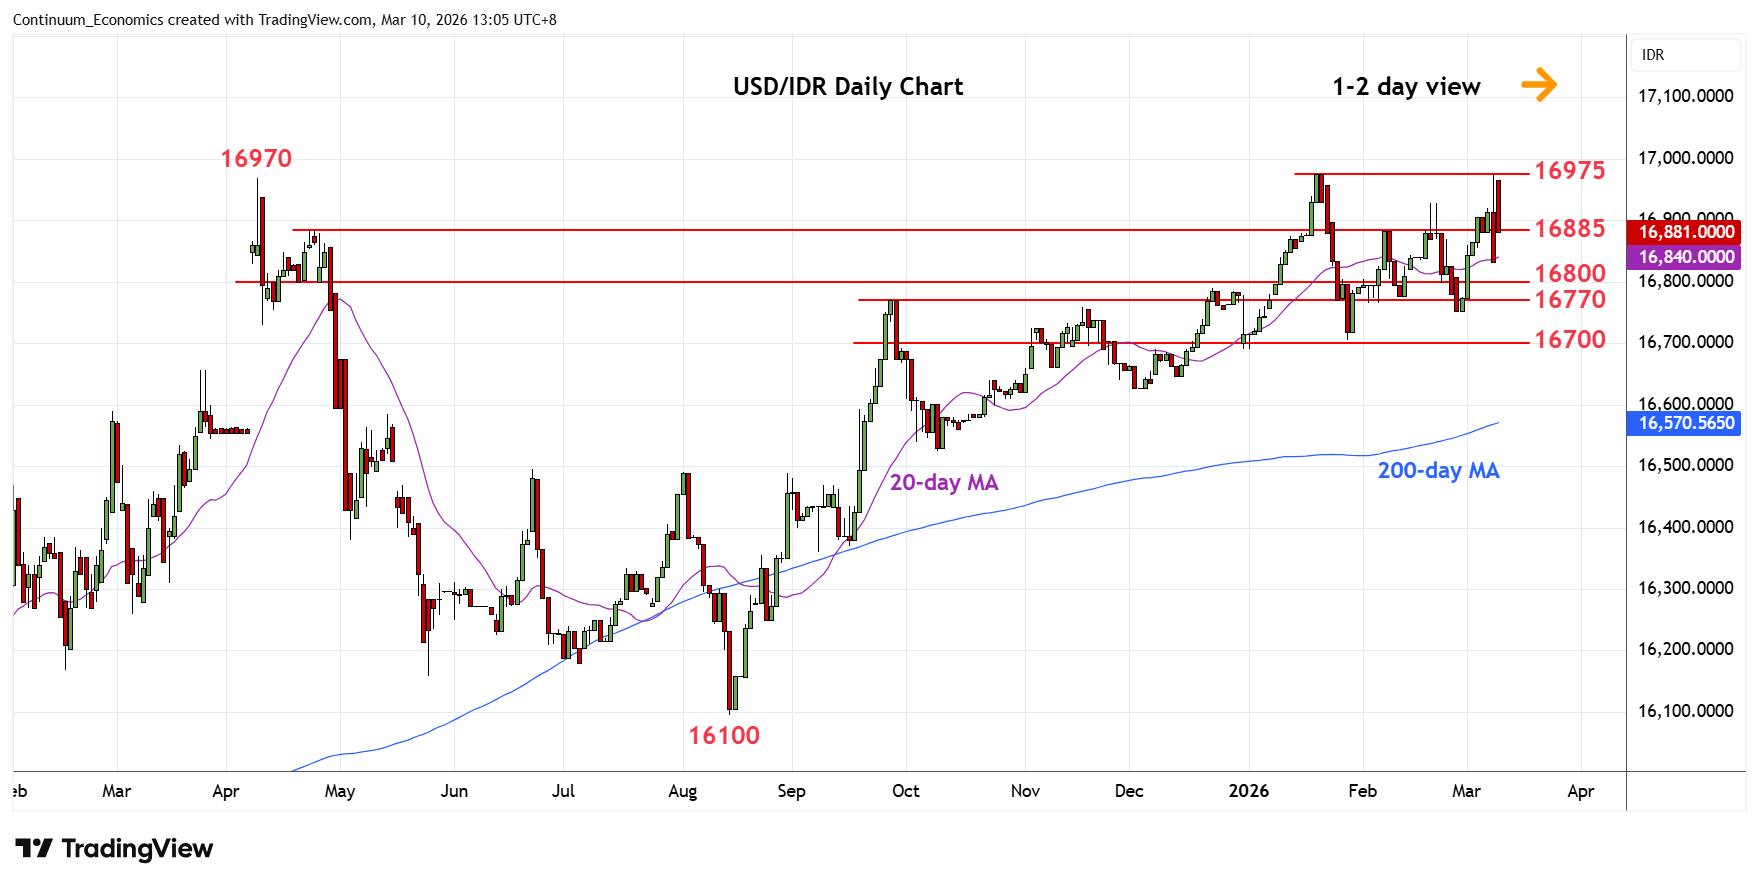
Turned down in consolidation from retest of the 16975 January historic high as prices unwind overbought intraday and daily studies
| Levels | Imp | Comment | Levels | Imp | Comment | |||
|---|---|---|---|---|---|---|---|---|
| R4 | 17270 | extension | S1 | 16800 | * | congestion | ||
| R3 | 17200 | projection | S2 | 16755 | ** | Feb low | ||
| R2 | 17000 | ** | figure | S3 | 16705 | ** | 28 Jan YTD low | |
| R1 | 16975 | ** | 20 Jan all-time high | S4 | 16640 | * | 38.2% Aug/Jan rally |
Asterisk denotes strength of level
05:30 GMT - Turned down in consolidation from retest of the 16975 January historic high as prices unwind overbought intraday and daily studies. Pullback see support at the 16855/16800 congestion. Would take break here to open up room for retest of critical support at 16755/16705, February and January current year low. Below these will confirm a double top pattern at the 16975 highs and see deeper pullback to retrace gains from the August low. Meanwhile, resistance at the 16975 high expected to cap.