Published: 2026-03-30T05:46:22.000Z
Chart USD/IDR Updates: Back to retest 16975/16995 highs
2
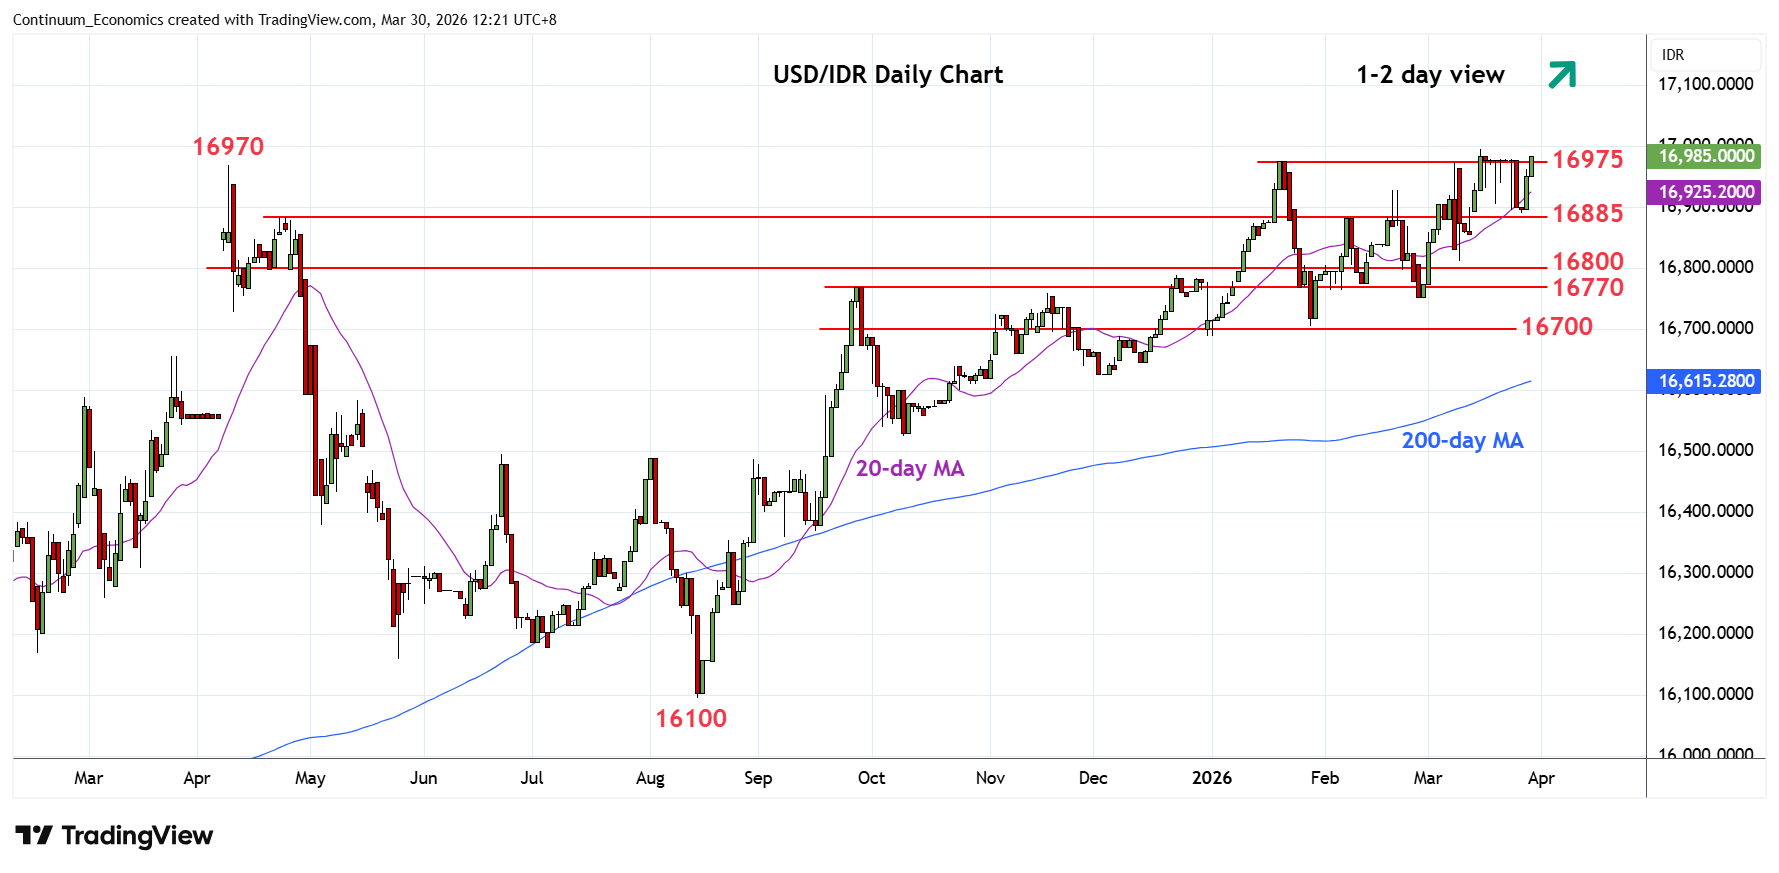
Bounce from the 16900/16885 support see prices back to retest the 16975/16995 highs
| Levels | Imp | Comment | Levels | Imp | Comment | |||
|---|---|---|---|---|---|---|---|---|
| R4 | 17600 | projection | S1 | 16885 | * | congestion | ||
| R3 | 17200 | projection | S2 | 16800 | * | congestion | ||
| R2 | 16995 | ** | 16 Mar high | S3 | 16755 | ** | Feb low | |
| R1 | 16975 | * | Jan high | S4 | 16705 | ** | 28 Jan YTD low |
Asterisk denotes strength of level
05:35 GMT - Bounce from the 16900/16885 support see prices back to retest the 16975/16995 highs. Daily studies remain overbought but break of the latter cannot be ruled out. Higher will extend the underlying bull trend and see room for extension to the 17200 and 17600 projection targets. Meanwhile, support at the 16900/16885 congestion area underpin. Would need break here to open up room for deeper pullback to retrace recent choppy gains from to the 16800 congestion. Below this will open up room for deeper pullback to the 16755/16705 February low and 28 January YTD low.