Published: 2025-10-29T04:41:49.000Z
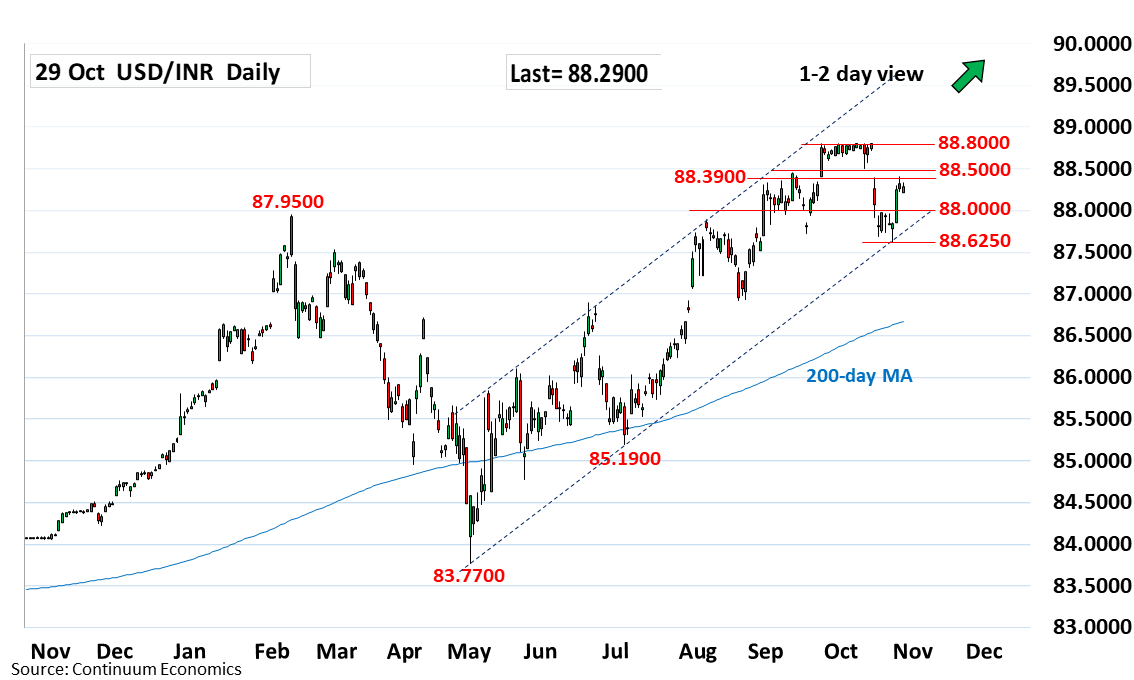
Chart USD/INR Update: Consolidating test of 88.3900 resistance
1
Settled back in consolidation from test of the 88.3900, 15 October high
| Level | Comment | Level | Comment | |||||
|---|---|---|---|---|---|---|---|---|
| R4 | 88.8000 | ** | 30 Sep all-time high | S1 | 88.0000 | * | congestion | |
| R3 | 88.7200 | 14 Oct low | S2 | 87.8500 | * | 5 Aug high | ||
| R2 | 88.5000 | ** | 10 Oct low | S3 | 87.6250 | ** | 24 Oct low | |
| R1 | 88.3900 | * | 15 Oct high | S4 | 87.4200 | * | 38.2% Jul/Sep rally |
Asterisk denotes strength of level
05:25 GMT - Settled back in consolidation from test of the 88.3900, 15 October high. However, daily studies are unwinding oversold readings and keep pressure on the upside, break here will see retest of strong resistance at the 88.5000 congestion and 10 October low. This area expected to cap and give way to fresh selling pressure later. Meanwhile, support is at the 88.0000 level which now underpin. Would take break here to return focus to the downside for retest of the 87.8500 support then the 87.6250 low and channel support.