Chartbook: Chart USD Index DXY: Pressuring range highs - gains to remain limited

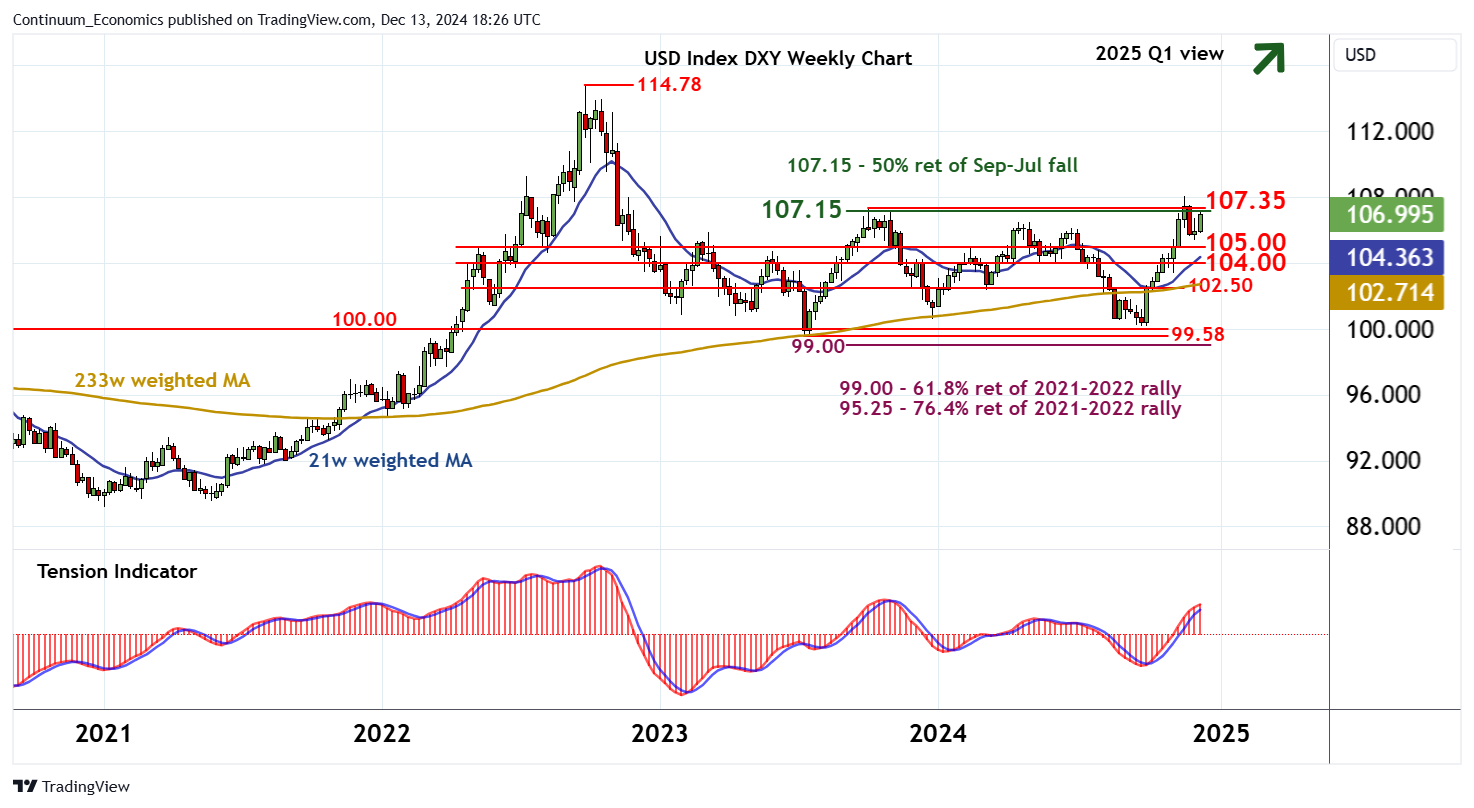
The anticipated break below support at the 99.58 year low of July 2023 and congestion around 100.00 has not been seen
The anticipated break below support at the 99.58 year low of July 2023 and congestion around 100.00 has not been seen,

as prices bounced sharply and posted steady gains into December.
Critical resistance at the 107.15 Fibonacci retracement and the 107.35 high of October 2023 has been reached, but unwinding overbought weekly stochastics and early signs of flattening in the rising weekly Tension Indicator are prompting consolidation beneath here.
A minor pullback is possible towards congestion support at 105.00. But a close below further congestion around 104.00 is needed to add weight to sentiment and prompt fresh consolidation within the broad consolidation pattern from July 2023.
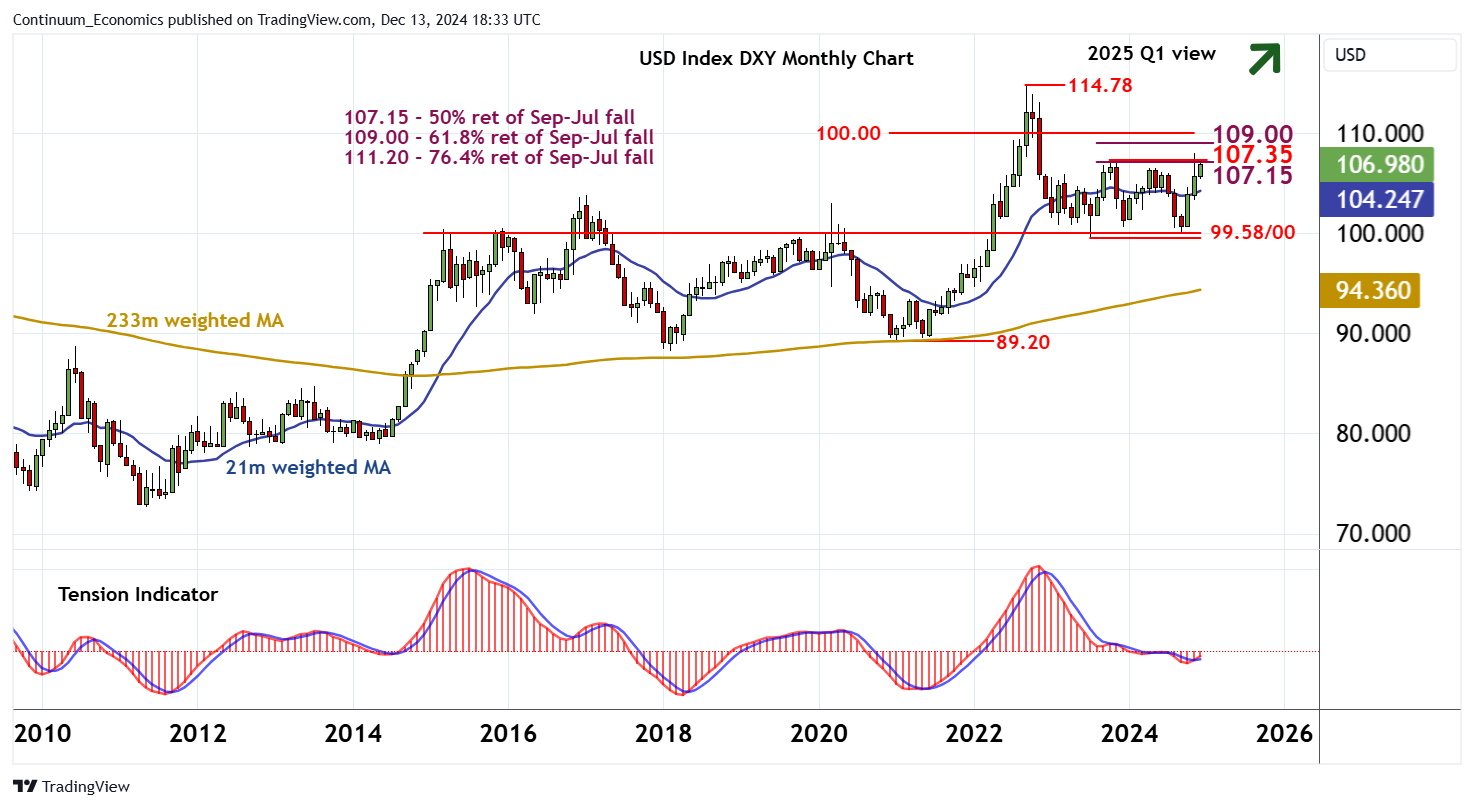
Rising monthly charts, however, suggest scope for still further gains into early 2025 Q1.

A close above 107.15/35 will confirm completion of the consolidation pattern, and extend July 2023 gains towards the 109.00 Fibonacci retracement.
Just higher is congestion around the psychological barrier at 110.00. But negative longer-term charts are expected to limit any initial tests of this area in profit-taking/consolidation. Continuation beyond here, if seen, will open up the 111.20 retracement, where more significant selling pressure is expected to appear.