Published: 2026-04-08T02:25:05.000Z
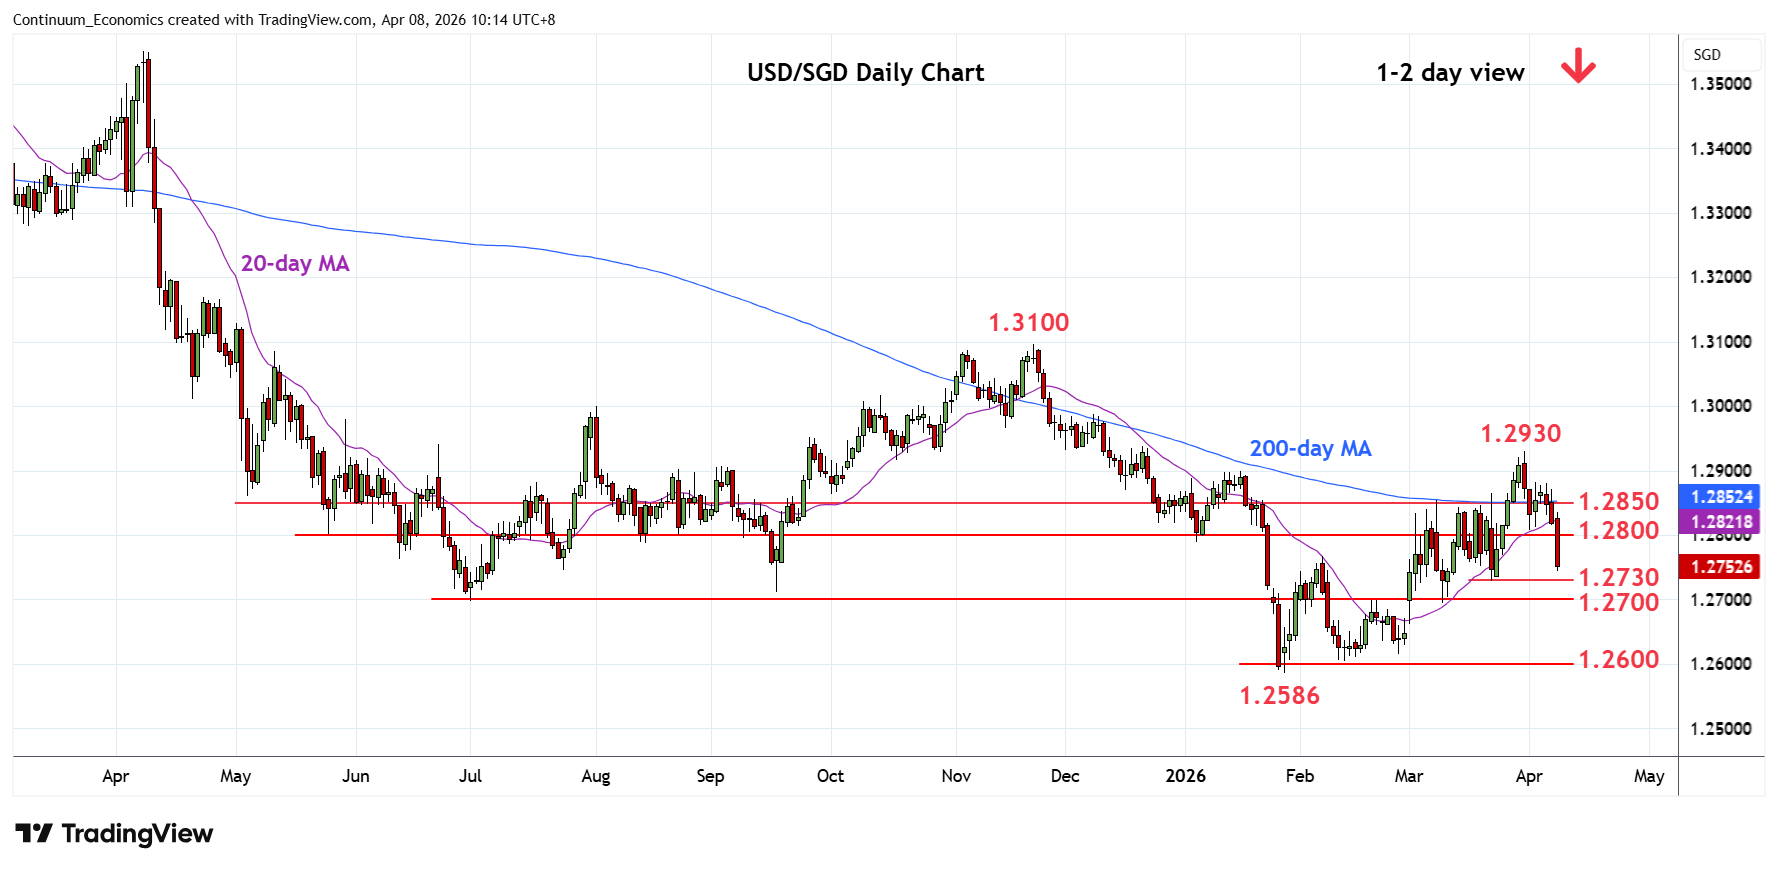
Chart USD/SGD Update: Extending losses from 1.2930 high
2
Consolidation above support at the 1.2800 level has given way to break to extend losses from the 1.2930, 31 March current year high
| Level | Comment | Level | Comment | ||||
|---|---|---|---|---|---|---|---|
| R4 | 1.2930 | ** | 31 Mar high | S1 | 1.2730 | * | 23 Mar low |
| R3 | 1.2900 | * | Jan high | S2 | 1.2700 | ** | 19 Feb high, 2025 yr low |
| R2 | 1.2850 | * | congestion | S3 | 1.2650 | congestion | |
| R1 | 1.2800 | * | congestion | S4 | 1.2600 | * | congestion |
Asterisk denotes strength of level
02:20 GMT - Consolidation above support at the 1.2800 level has given way to break to extend losses from the 1.2930, 31 March current year high. Breakdown see room for extension to support at 1.2730 then the 1.2700 level and 2025 year low. Negative daily and weekly studies highlights risk for break of these to return focus to the 1.2600 level and 1.2586, January current year low. Meanwhile, resistance is lowered to the 1.2800/1.2850 congestion area which is expected to cap and sustain losses from the 1.2930 YTD high.