Chart EUR/CAD Update: Bounce from strong support - studies under pressure
The test of strong support within the 1.6170~ weekly lows from mid-September to mid-October, and congestion around 1.6200, has bounced smartly from 1.6145
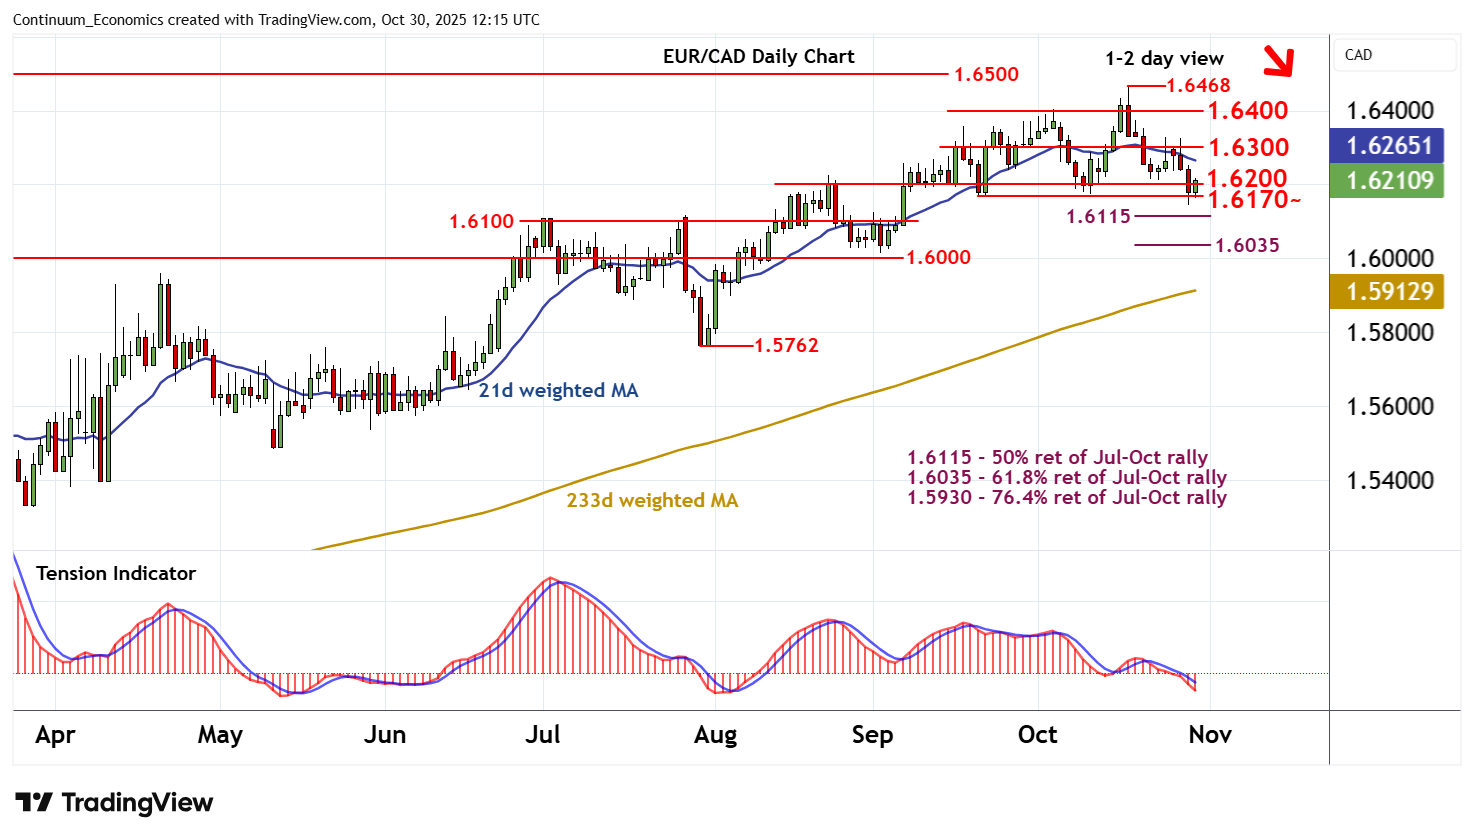
| Level | Comment | Level | Comment | |||||
|---|---|---|---|---|---|---|---|---|
| R4 | 1.6500 | * | historic congestion | S1 | 1.6200 | * | congestion | |
| R3 | 1.6468 | * | 17 Oct YTD high | S2 | 1.6170~ | ** | 19 Sep-10 Oct (w) lows | |
| R2 | 1.6400 | * | break level | S3 | 1.6115 | ** | 50% ret of Jul-Oct rally | |
| R1 | 1.6300 | * | congestion | S4 | 1.6100 | * | congestion |
Asterisk denotes strength
12:05 GMT - The test of strong support within the 1.6170~ weekly lows from mid-September to mid-October, and congestion around 1.6200, has bounced smartly from 1.6145, as oversold intraday studies unwind, with prices once again trading above 1.6200. Daily readings continue to point lower and broader weekly charts are under pressure, highlighting difficulty sustaining higher levels. A test of congestion resistance at 1.6300 is not looked for. In the coming sessions, cautious trade is expected to give way to fresh losses. A later close below 1.6170~ will add weight to sentiment and confirm a near-term top in place at the 1.6468 current year high of 17 October, as deeper losses then focus on 1.6100/15.