Published: 2026-01-02T17:22:31.000Z
Chart USD/MXN Update: Poised for further losses
-
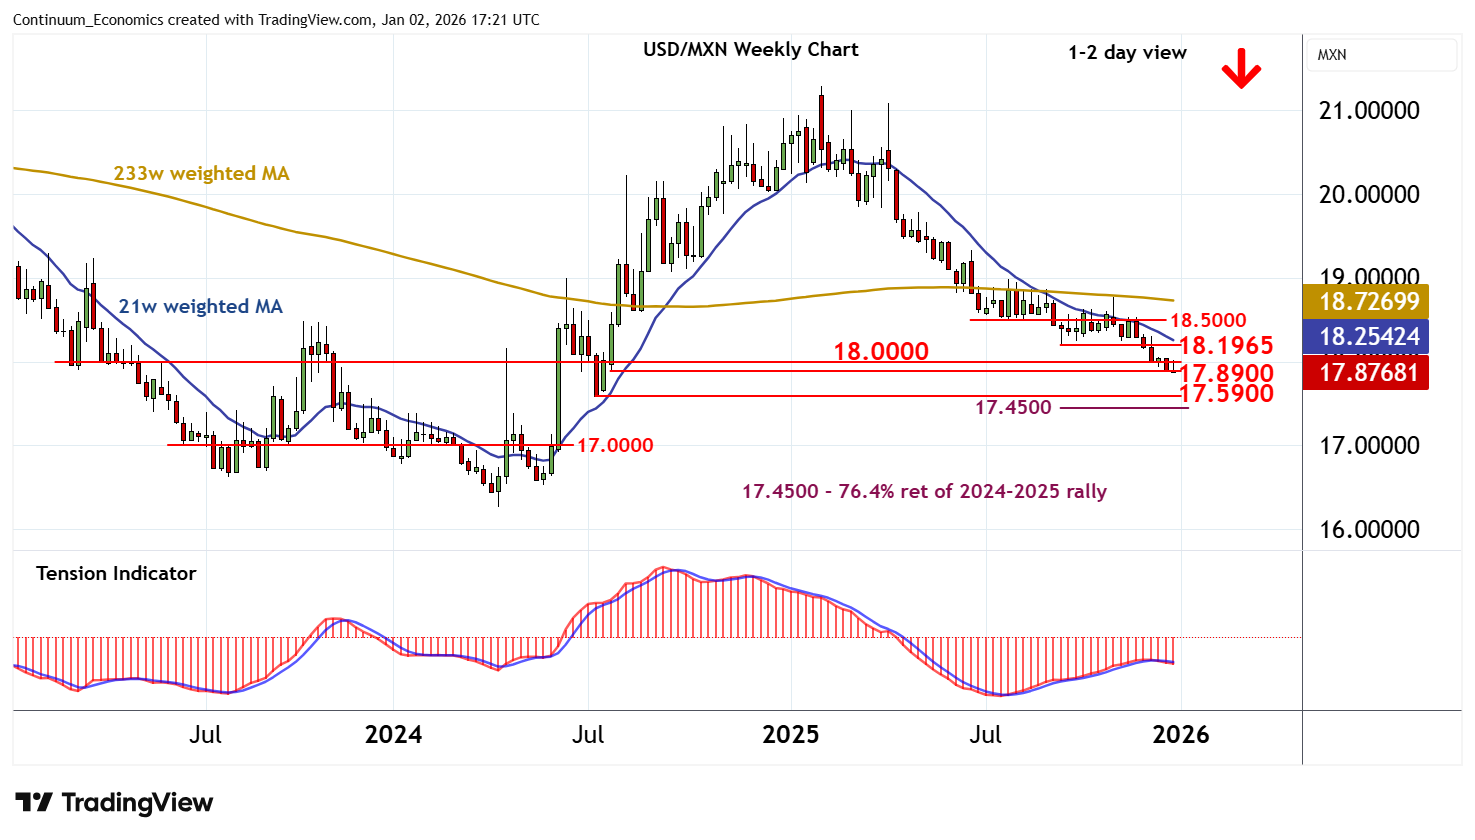
Little change, as cautious trade extends pressure on strong support at the 17.8900 weekly low from late-July 2024
| Levels | Imp | Comment | Levels | Imp | Comment | |||
|---|---|---|---|---|---|---|---|---|
| R4 | 18.5000 | * | congestion | S1 | 17.8900 | * | late-July 24 (w) low | |
| R3 | 18.1965 | ** | 17 Sep (m) low | S2 | 17.5900 | ** | 12 Jul 2024 (m) low | |
| R2 | 18.1500 | minor congestion | S3 | 17.4500 | ** | 76.4% ret of 2024-2025 rally | ||
| R1 | 18.0000 | ** | congestion | S4 | 17.0000 | ** | congestion |
Asterisk denotes strength of level
17:05 GMT - Little change, as cautious trade extends pressure on strong support at the 17.8900 weekly low from late-July 2024. Daily readings are turning down and broader weekly charts are negative, highlighting room for fresh losses in the coming sessions. A break below 17.8900 will add weight to sentiment and extend February 2025 losses towards the 17.5900 monthly low of July 2024. Meanwhile, resistance is lowered to congestion around 18.0000. A close above here, if seen, will help to stabilise price action and prompt consolidation beneath the 18.1965 monthly low of 17 September.