Published: 2026-03-05T12:00:49.000Z
Chart EUR/CAD Update: Extending losses
1
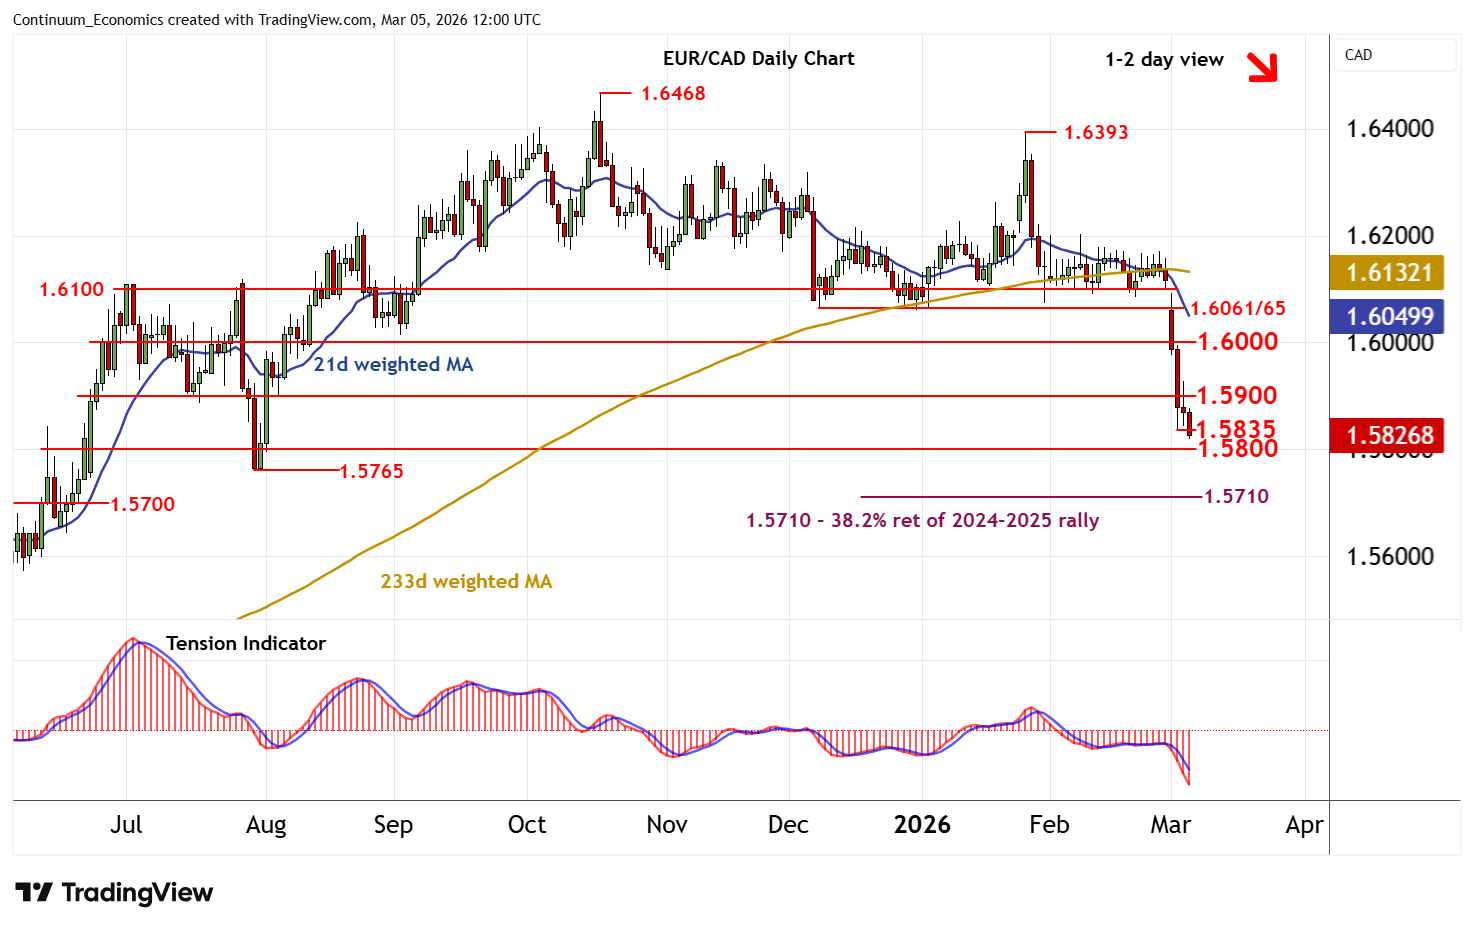
The anticipated test above congestion resistance at 1.5900 has been pushed back from 1.5925/30
| Level | Comment | Level | Comment | |||||
|---|---|---|---|---|---|---|---|---|
| R4 | 1.6100 | * | congestion | S1 | 1.5835 | 3 Mar low | ||
| R3 | 1.6061/65 | * | Dec-Feb range lows | S2 | 1.5800 | minor congestion | ||
| R2 | 1.6000 | ** | congestion | S3 | 1.5765 | * | 30 July (m) low | |
| R1 | 1.5900 | minor congestion | S4 | 1.5700/10 | ** | cong; 38.2% ret |
Asterisk denotes strength
11:25 GMT - The anticipated test above congestion resistance at 1.5900 has been pushed back from 1.5925/30, as intraday studies turn down, with steady losses currently pressuring support at the 1.5835 low of 3 March. Daily and weekly charts are negative, highlighting room for further losses, with a break beneath here targeting congestion around 1.5800. Continuation beneath here will extend October 2025 losses initially towards the 1.5765 monthly low of 30 July. Meanwhile, an unexpected close above 1.5900 will help to stabilise price action and prompt consolidation beneath further congestion around 1.6000.