Published: 2026-01-28T08:14:47.000Z
Chart USD/BRL Update: Extending losses
1
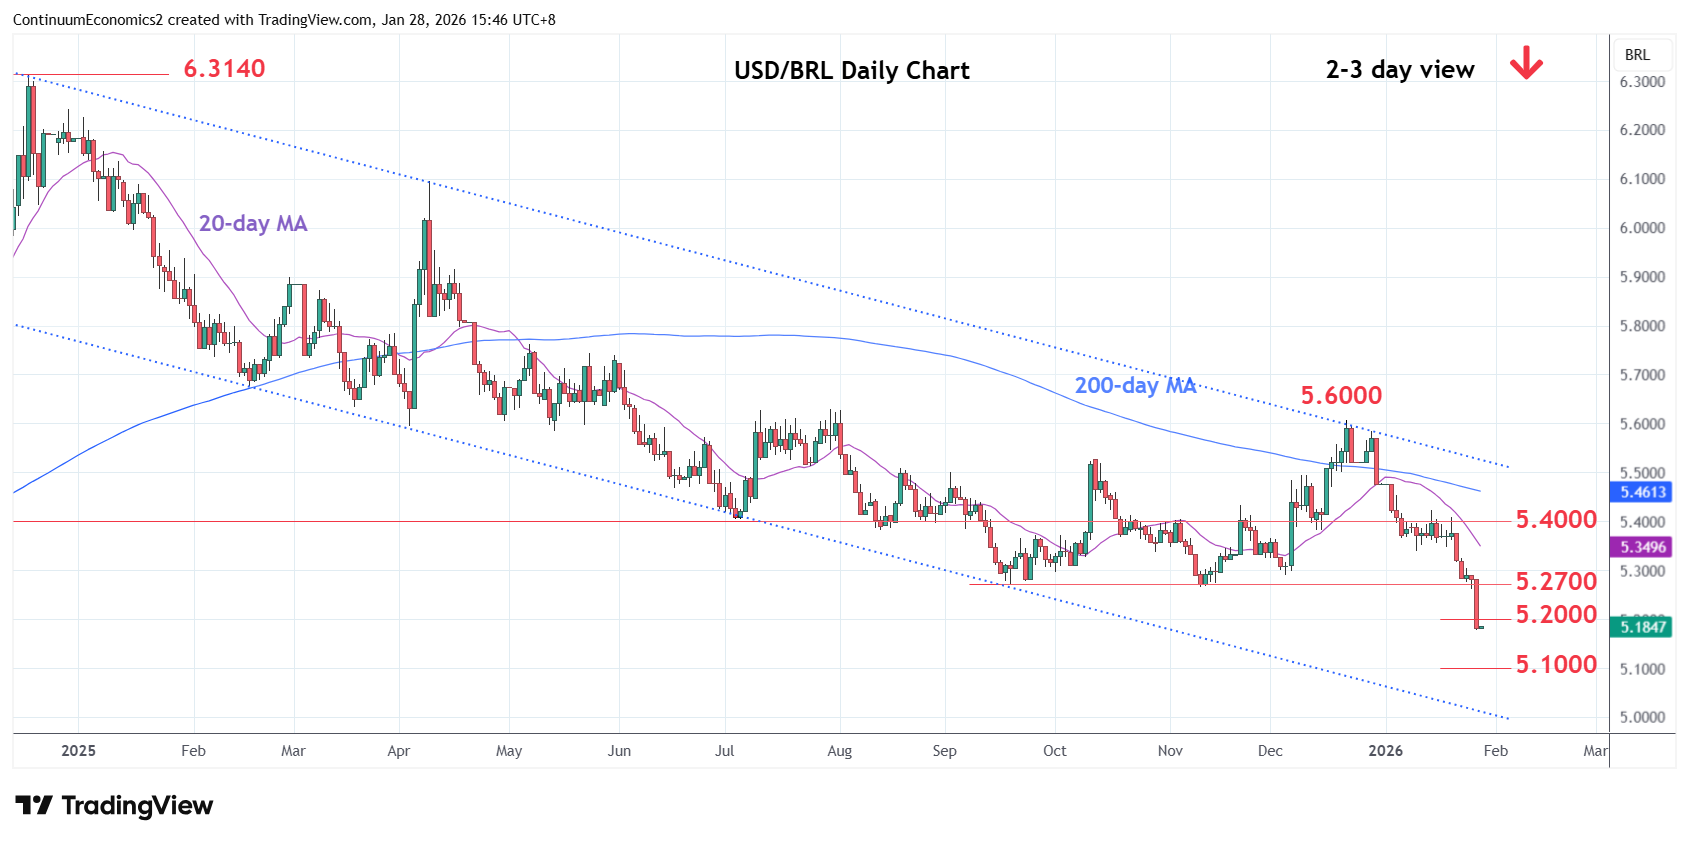
Break of the 5.2700, 2025 year lows, has seen losses to reach fresh year low at 5.1780
| Levels | Imp | Comment | Levels | Imp | Comment | |||
|---|---|---|---|---|---|---|---|---|
| R4 | 5.4000 | * | congestion | S1 | 5.1780 | * | 27 Jan YTD low | |
| R3 | 5.3500 | * | congestion | S2 | 5.1500 | * | congestion | |
| R2 | 5.3000 | * | congestion | S3 | 5.1000 | ** | figure | |
| R1 | 5.2700 | ** | Sep/Nov 2025 year lows | S4 | 5.0850 | congestion |
Asterisk denotes strength of level
08:10 GMT - Break of the 5.2700, 2025 year lows, has seen losses to reach fresh year low at 5.1780. Consolidation here see prices unwinding oversold intraday studies but daily and weekly charts are bearish, highlighting room for further losses ahead. Lower will see room to further extend losses within the bearish channel from the December 2024 year high to congestion at 5.1500. Lower still, will see room to the 5.1000 figure. Meanwhile, resistance is lowered to the 5.2700, 2025 year low. A close above here is needed to ease the bearish pressure and see room for stronger bounce to retrace losses from 5.6000, December high.