Published: 2025-09-23T05:00:17.000Z
Chart USD/IDR Updates: Extending gains
-
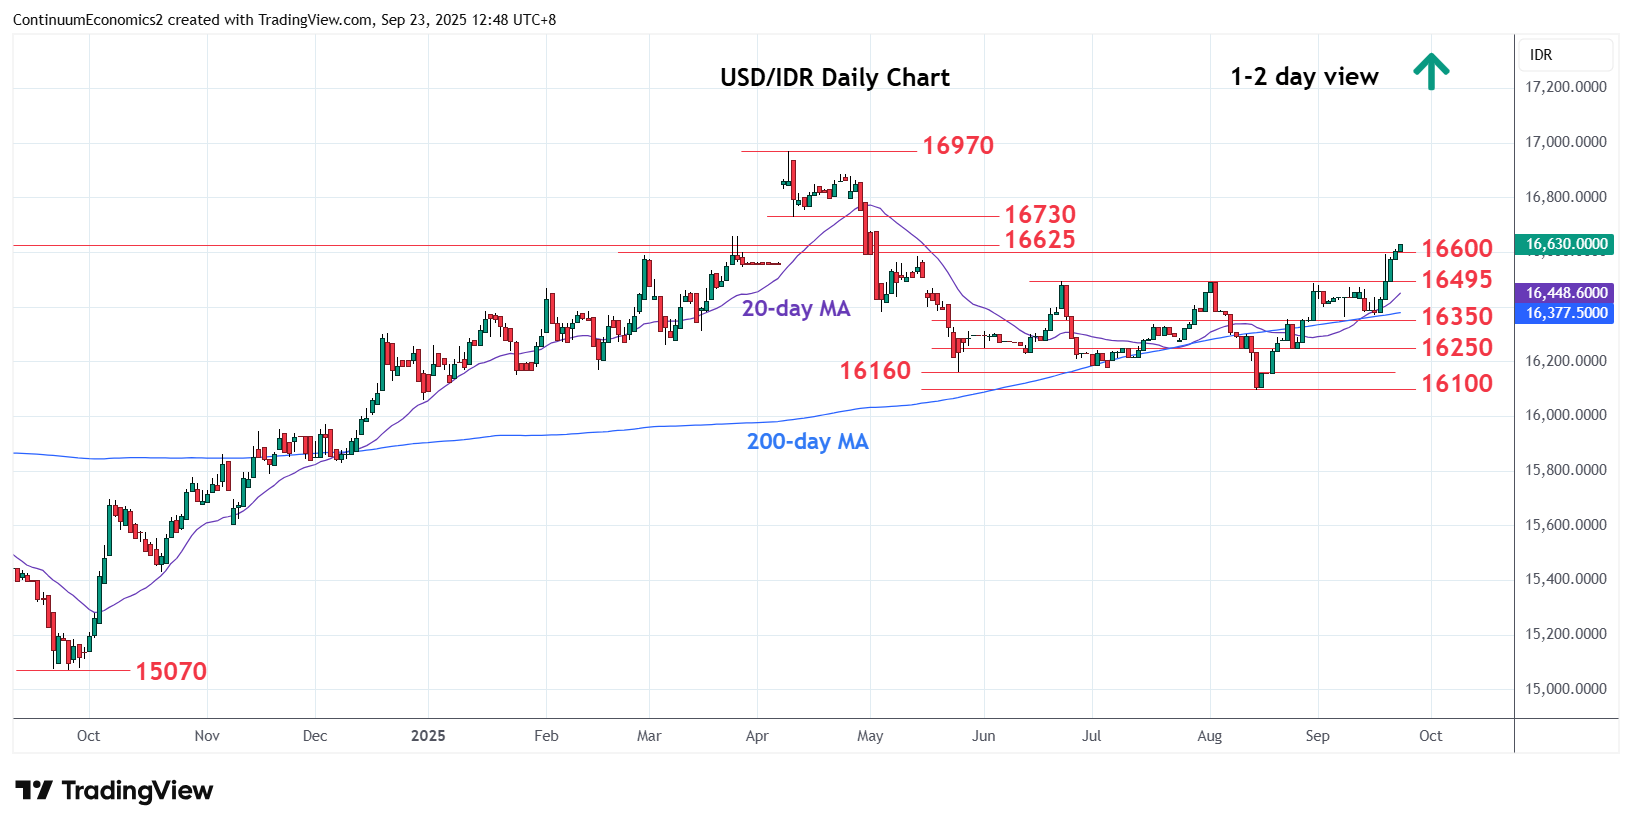
Extending the bullish break of the 16490/16495 August/June highs to reach the 16600/16625 resistance
| Levels | Imp | Comment | Levels | Imp | Comment | |||
|---|---|---|---|---|---|---|---|---|
| R4 | 16884 | * | 24 Apr high | S1 | 16495/90 | ** | Jun/Aug highs | |
| R3 | 16800 | * | congestion | S2 | 16350 | * | congestion | |
| R2 | 16730 | ** | 10 Apr low | S3 | 16250 | * | 25 Aug low | |
| R1 | 16625 | ** | Mar 2020 year high | S4 | 16100 | ** | Aug low |
Asterisk denotes strength of level
05:00 GMT - Extending the bullish break of the 16490/16495 August/June highs to reach the 16600/16625 resistance. Bullish momentum see room to extend bounce from the 16100 low to further retrace losses from the April current year high. Higher will see room to strong resistance at 16730 and the 16800 level. Meanwhile, support is raised to 16495/16490, June/August highs which should underpin. Would take break here to fade the upside pressure and open up room for pullback to support at the 16350 and 16250 congestion.