Published: 2026-02-05T04:23:06.000Z
Chart USD/IDR Updates: Retracing the January losses
5
Consolidation below the 16800 resistance has given way to break to further retrace the January losses
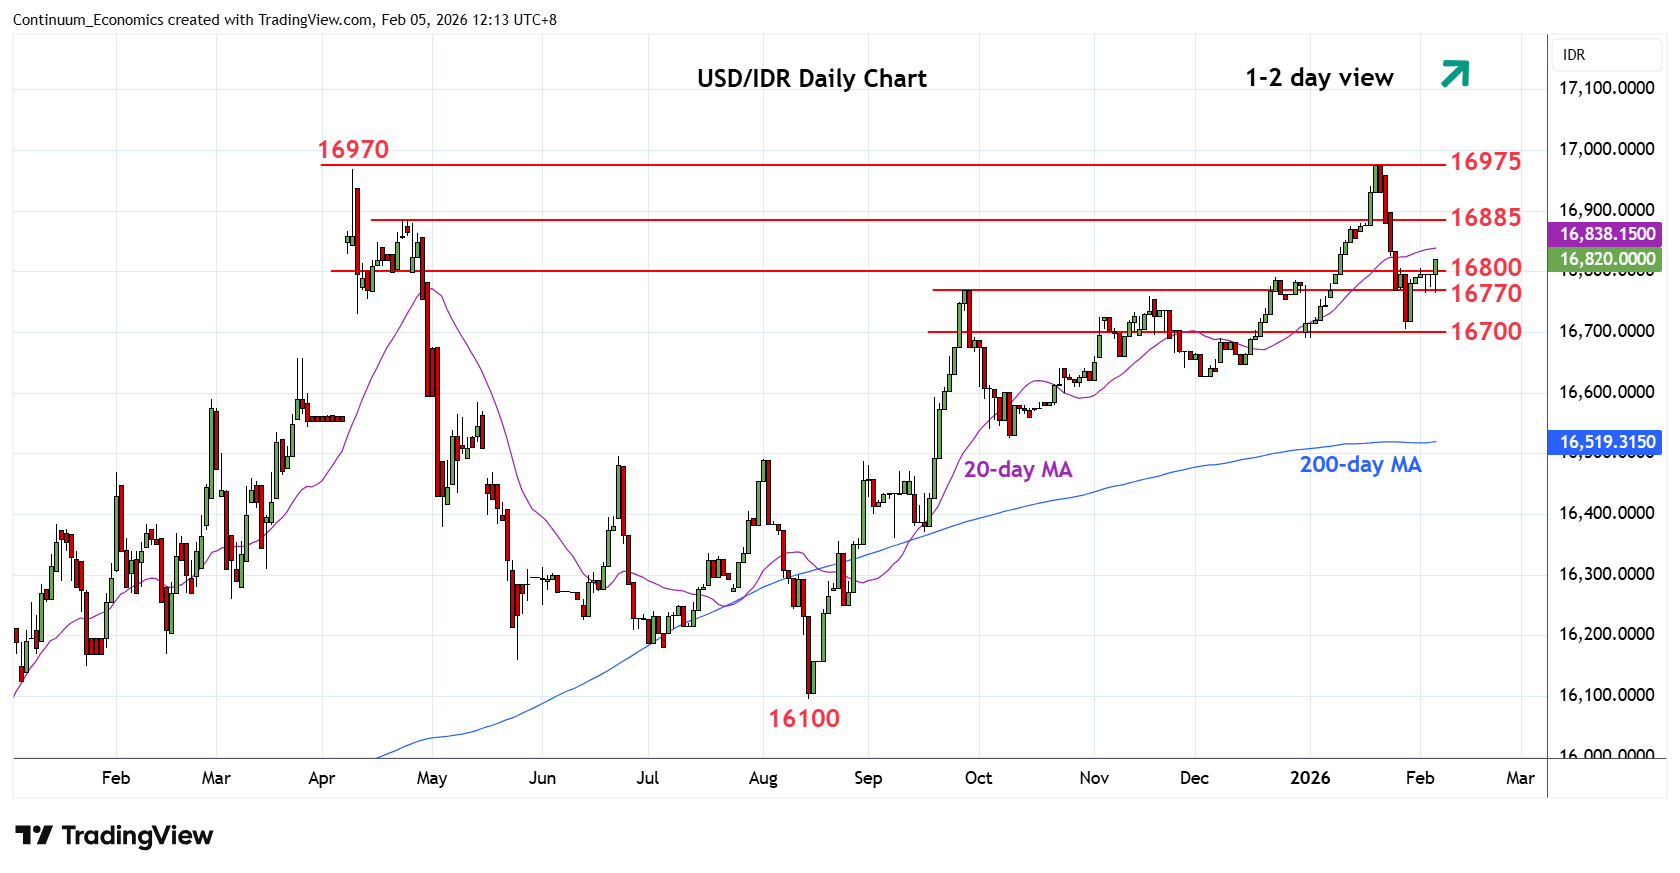
| Levels | Imp | Comment | Levels | Imp | Comment | |||
|---|---|---|---|---|---|---|---|---|
| R4 | 17050 | * | projection | S1 | 16770 | * | Sep high | |
| R3 | 16975 | ** | 20 Jan all-time high | S2 | 16705 | ** | Jan low | |
| R2 | 16930 | * | congestion | S3 | 16690 | * | 31 Dec low | |
| R1 | 16885 | * | 23 Apr high | S4 | 16640 | * | 38.2% Aug/Jan rally |
Asterisk denotes strength of level
04:20 GMT - Consolidation below the 16800 resistance has given way to break to further retrace the January losses. Higher will see room to the resistance at the 16885/16900 area. Gains are seen corrective and giving way to renewed selling pressure later. Meanwhile support is raised to the September high at 16770. Below this will expose 16705 low and see deeper pullback to retrace the August/January gains. Lower will see extension to support at 16690 and the 16640, 38.2% Fibonacci level. Lower still, will turn focus to strong support at 16625/16600, December/November lows.