DM Government Bonds: Risks of Higher Long End Premia?
· Our baseline is for DM government bond yields ex Japan to remain elevated, but controlled. Japan extra risk premium is driven by BOJ QT at 6% of GDP, more than long-term debt fears. Major catalysts could drive a regime change to higher risk premia and steeper yield curves, but none of the known catalysts are moderate or high probability currently. However, the whole debate does reinforce our bias towards DM fiscal saints such as Australia, Canada, Sweden, Norway, Netherlands/Germany.
Could DM countries with high government debt/GDP trajectories see investors demand a higher risk premium and steeper yield curves in the future amid electorates reluctant to accept fiscal consolidation or inflation persistently higher than target?
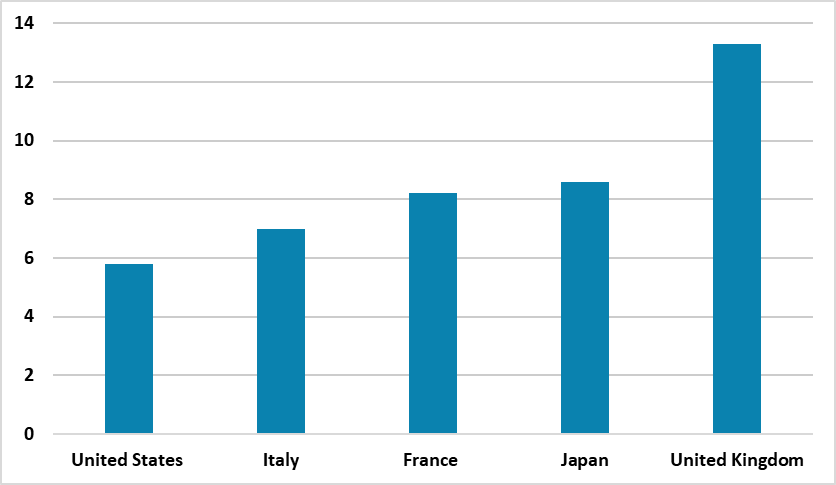
Figure 1: 10-2yr Government Bond Spread – Select Countries (%)
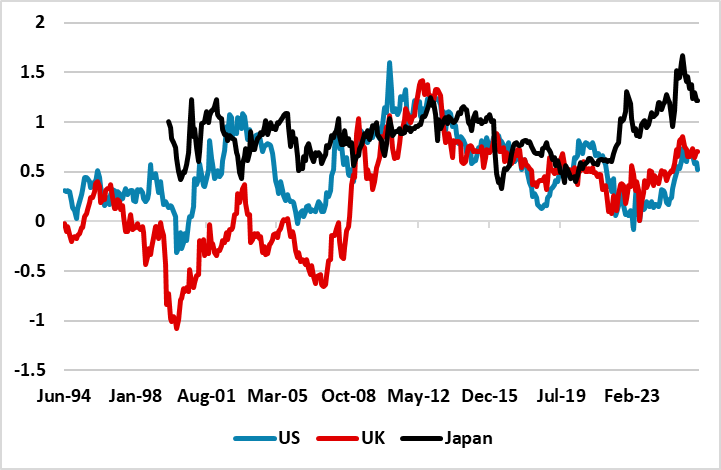
Source: Datastream/Continuum Economics
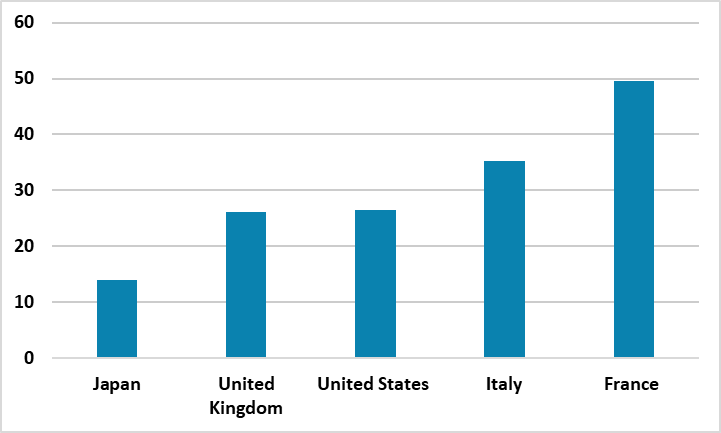
Though we have highlighted that DM government bond markets remain in limbo, they are still well controlled with the U.S/EZ and UK seeing yield curve flattening driven by a change of rate expectations at the front end. Indeed, compared to the 1994-2007 period, 10-2yr yield curves have been steeper in the U.S. and UK (Figure 1) – 10-2yr Germany reached 250bps in 1996. This 1994-07 period is not an exact match for current conditions, but it did have modest cyclical and structural inflation phases followed by controlled inflation. 30-10yr U.S. and UK yields (Figure 2) were also steeper in this period compared to now. Could investors facing persistent budget deficits and high/rising government debt/GDP trends demand an extra premium for the 10yr curve outwards and steepening yield curves – especially as voters are wary of fiscal consolidation?
Figure 2: 30-10yr Government Bond Spread – Select Countries (%)

Source: Datastream/Continuum Economics
Japan is already seeing a steeper 10-2yr and 30-10yr curve, despite the normal being yield curve flattening when central banks tighten. However, the current phase of abnormal JGB behavior is due to the huge BOJ QT that we estimate at 6% of GDP (Figure 3) and also the exit from ultra-low policy rates. The BOJ on June 16 will likely slow QT, but not enough to prevent market problems with heavy supply from the combined QT/Budget deficit.
Figure 3: 2026 Budget Deficit and QT to GDP (%)
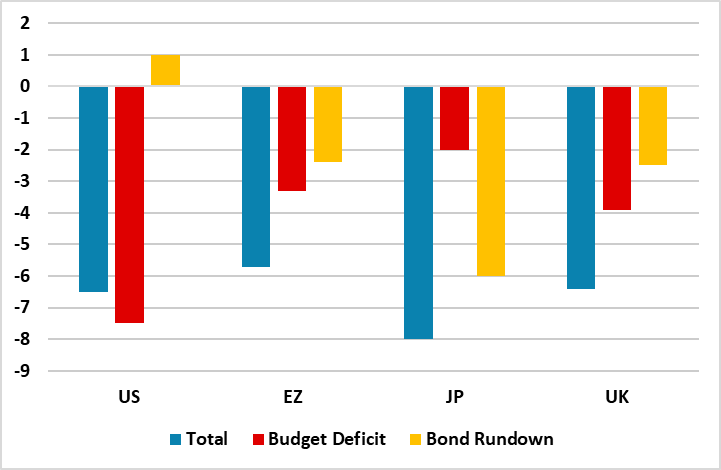
Source: IMF April 26 Fiscal Monitor/Continuum Economics
A switch to investors demanding extra risk premium for deficit/debt trends would probably require a new catalyst. On net government/debt to GDP trends (Figure 4), the U.S. is showing a clear unstable trend, which is due to the persistently large budget deficit. This becomes clear by stripping out debt servicing costs and looking at primary deficits (Figure 5), where the U.S. and then Japan stand out. The counterargument for the U.S. is that it remains the global reserve currency and this allows a higher debt/GDP trajectory than other countries.
Figure 4: Net Government Debt/GDP (%)
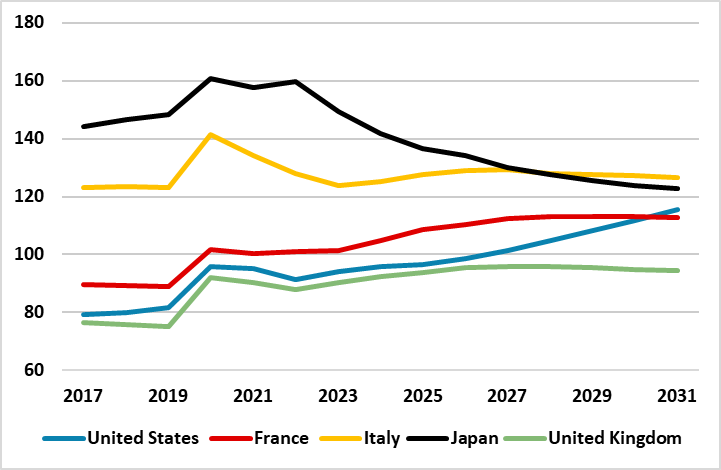
Source: IMF April 26 Fiscal Monitor
Figure 5: General Government Primary Balance (% of GDP)
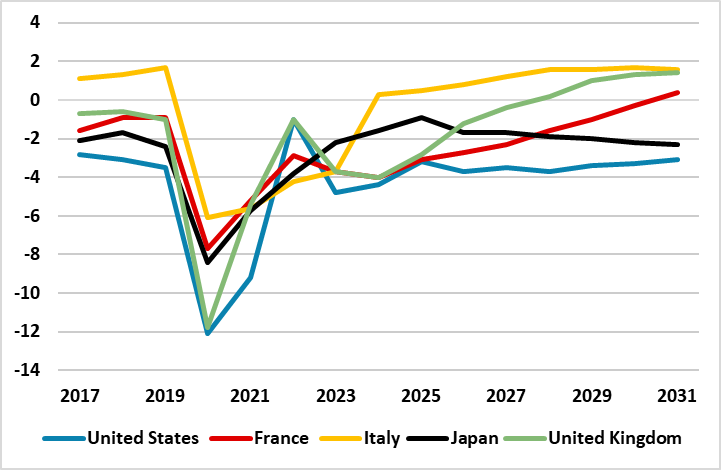
Source: IMF April 26 Fiscal Monitor
However, it is also worth highlighting two other debt metrics. Firstly, non resident holdings of general government debt (Figure 6), as any major adverse policy shock could see some liquidation of existing foreign holdings pressurize the supply picture. Most are modest to moderate, except France and Italy. The counter is that this is mainly from other EZ countries that have no currency risk, but a major shock could still see reduction from other EZ countries. The 2nd measure is average term to maturity, where the U.S. has the shortest maturity and in a crisis period would have to rollover a lot of debt each year.
Figure 6: Non Resident Holdings of General Government Debt 2025 (% of total)
Source: IMF April 26 Fiscal Monitor
Figure 7: Average Term to Maturity (%)
Source: IMF April 26 Fiscal Monitor
The key is a major adverse shock would have to occur. What would they be for the 5 countries we have looked at?
U.S. The mid terms will likely see a split congress and no major fiscal easing 2027-28 and then depend on fiscal policy after the 2028 elections outcome (an uncertain probability at this stage). Instead, we are focused on the impact of AI on jobs, income and tax. Income taxes are a major portion of U.S. federal tax revenue and an AI job apocalypse could permanently hurt U.S. fiscal trends. However, this is not our baseline and instead we look for gradual net jobs losses (here). The other issue is if the Fed acts inflation persistently modestly above target, which could see more of risk premia. Though Fed chair Warsh wanst to shrink the balance sheet, the majority on the FOMC appears opposed to new QT that could steepen the yield curve and potentially cause money market disruption.
Japan. Japanese voters are sick of fiscal consolidation, which has driven PM Takaichi to power. However, Takaichi’s fiscal easing has been modest, as the current government understands the modest fiscal space that exists. Additionally, a larger than expected U turn from the BOJ on QT would also allow more fiscal space. Japan demographics are also not just a long-term factor, but do impact the size of the workforce and tax revenue from Income tax.
UK. With a more left leaning Labour PM and Chancellor likely, a major fiscal easing in the UK would be a catalyst for a still steeper Gilt curve. However, the 2022 Truss debacle still haunts UK politics and will likely restrain the scale of new fiscal measures (though could led to higher UK taxes. Also the BOE are set to slow QT again in September from £70bln to £50bln.
Italy. A new Italian government after the 2027 general election could be pushed by Italian voters towards fiscal easing, which would cause Italian debt tensions. However, this is unlikely and the central scenario is that PM Meloni is reelected. Italy demographics are also not just a long-term factor, but do impact the size of the workforce and tax revenue from Income tax.
France. If parliamentary elections are held and elected a left wing government that new fiscal deterioration could occur that causes a fiscal crisis. The ECB TPI may not come to the rescue in such a scenario, but APP/PEPP QT could be slowed. However, this is an unlikely political scenario. The most likely scenario is that a centrist candidate wins the 2027 French presidential election and tries to muddlethrough on annual French budgetary policy but where large fiscal gaps persist, if not grow. Not great, but not a disaster.
All countries have scenarios that could cause a debt market crisis, but these are not currently neither moderate nor high probability. Debt investors will keep an eye on these and could demand some extra risk premia, if the odds increase. However, it could be that debt investor sentiment shifts without a catalyst, which could still produce steeper yield curves.
The experience in EM is that the shifts can be violent, such as S Africa 2020 and Brazil 2008/2018/2020 (Figure 8). One way for debt investors to play for safety in DM government bonds is to play the fiscal sinners versus the saints. Australia net government debt/GDP is a low 32%, but 10yr yields are trading at a premium to the U.S. Traditionally, the market has not separated out fiscal sinners and saints, with the relative policy rate spread being a key driving force (Figure 8). However, attitudes are changing and fixed income managers worried about an extra risk premium for long dated U.S. Treasuries should consider the case for an Australia multi-year versus the U.S.
Figure 8: 10-2yr Government Bond Spread – Select EM Countries (%)
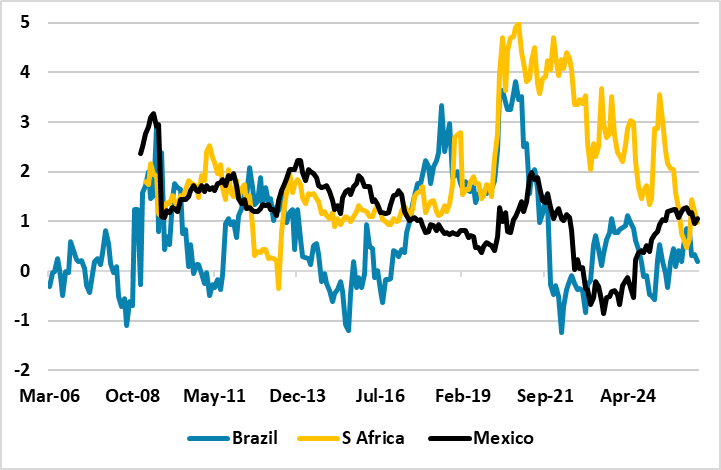
Source: Datastream/Continuum Economics
Figure 9: 10 AUD-U.S. and RBA-Fed Policy Spread (%)
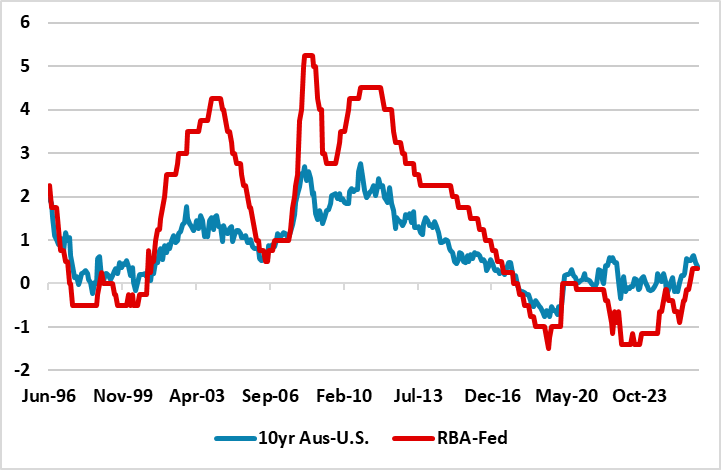
Source: Datastream/Continuum Economics