Published: 2026-03-04T06:22:52.000Z
Chart USD/CNH Update: Consolidating test of 6.9300/6.9500 resistance
1
Break above the 6.9000 level has seen extension to reach resistance at the 6.9300/6.9500 congestion
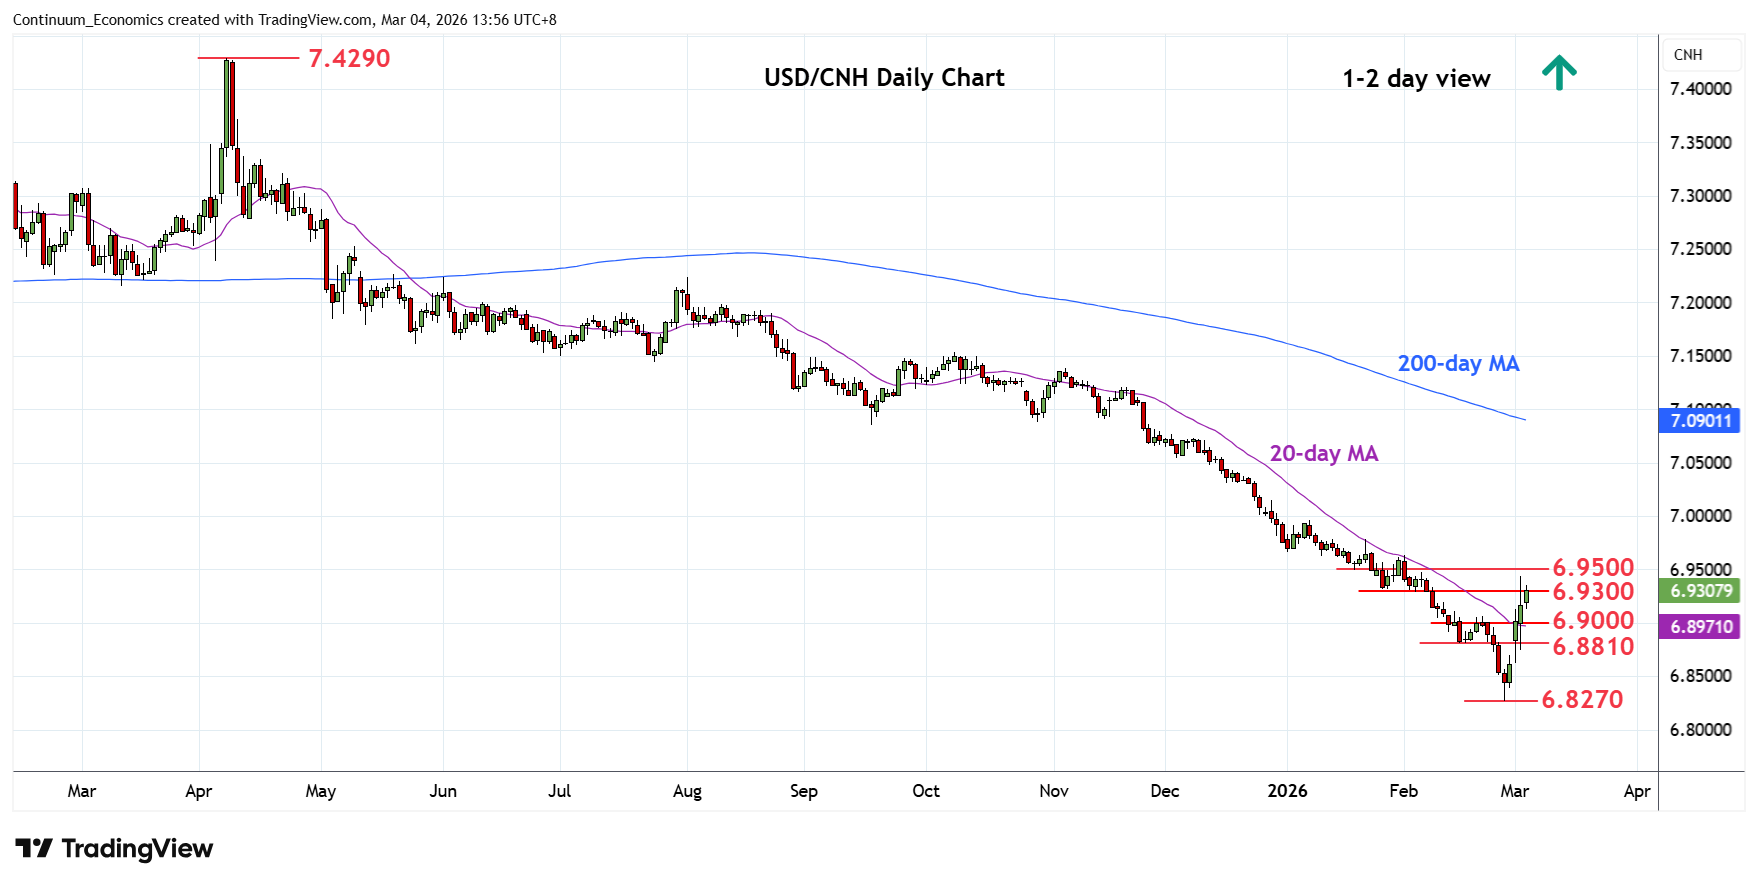
| Level | Imp | Comment | Level | Imp | Comment | |||
|---|---|---|---|---|---|---|---|---|
| R4 | 7.0000 | ** | figure | S1 | 6.9000 | * | congestion | |
| R3 | 6.9700 | * | 2024 year low | S2 | 6.8810 | ** | 16 Feb low | |
| R2 | 6.9500 | * | congestion | S3 | 6.8500 | * | congestion | |
| R1 | 6.9300 | ** | Jan low, congestion | S4 | 6.8270 | ** | 26 Feb YTD low |
Asterisk denotes strength of level
06:15 GMT - Break above the 6.9000 level has seen extension to reach resistance at the 6.9300/6.9500 congestion. Consolidation here see prices unwind overbought intraday studies but positive daily and weekly studies room for further gains later. Above the 6.9500 level will see room to extend corrective gains to retrace losses from the October swing high. Clearance will see room to resistance at 6.9700 and 7.0000 figure. Meanwhile, support is raised to 6.9000/6.8810 support area which should underpin. Only below this will fade the upside pressure and return focus to the downside.