Published: 2026-01-16T05:15:45.000Z
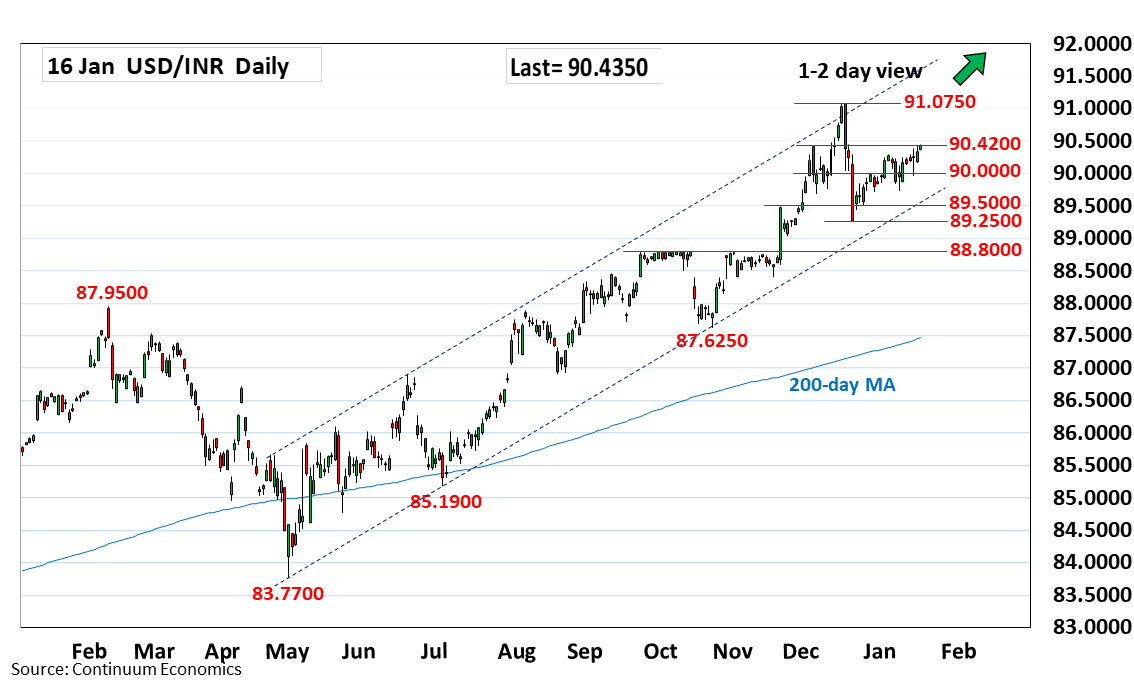
Chart USD/INR Update: Extending gains from 89.2500 low
-
Extending bounce from the 89.2500 December low to reach towards the 90.5000 congestion
| Level | Comment | Level | Comment | |||||
|---|---|---|---|---|---|---|---|---|
| R4 | 91.5500 | * | projection | S1 | 90.0000 | * | figure | |
| R3 | 91.5000 | * | projection | S2 | 89.7200 | ** | 30 Dec low | |
| R2 | 91.0750 | ** | Dec 2025 all-time high | S3 | 89.5000 | * | congestion | |
| R1 | 90.5000 | * | congestion | S4 | 89.2500 | ** | Dec low |
Asterisk denotes strength of level
05:10 GMT - Extending bounce from the 89.2500 December low to reach towards the 90.5000 congestion to retrace losses from the 91.0750 record high. However, gains are seen corrective and only break here will expose the 91.0750 record high to retest. Overbought daily studies suggest this keeping out of reach and expected to give way to renewed selling pressure later. Support is at the 90.0000 figure and break here will return focus to the downside for retest of the 89.5000 congestion then 89.2500 December low. Below these will further retrace to May/December rally.