Published: 2026-02-25T02:53:41.000Z
Chart USD/THB Update: Still limited below the 31.00 level
1
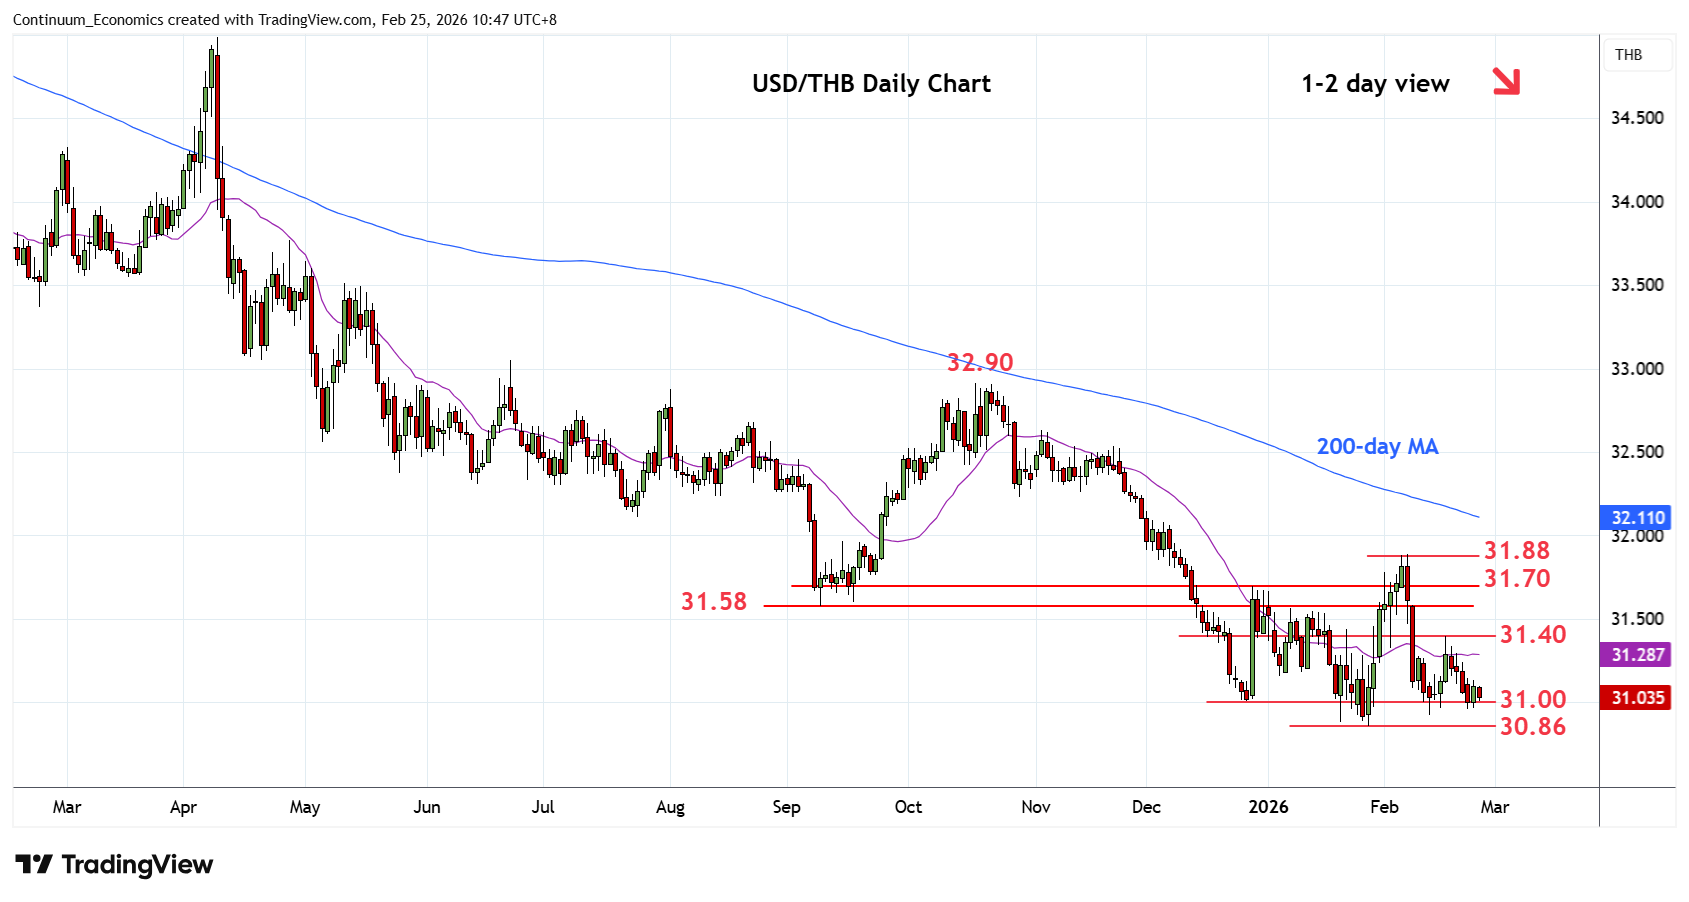
Still little change, as prices extend consolidation above the 31.00 level
| Level | Comment | Level | Comment | |||||
|---|---|---|---|---|---|---|---|---|
| R4 | 31.80 | * | congestion | S1 | 31.00 | * | Dec low | |
| R3 | 31.70 | * | congestion | S2 | 30.86 | ** | 28 Jan YD low | |
| R2 | 31.58/60 | ** | Sep low, congestion | S3 | 30.80 | * | congestion | |
| R1 | 31.40 | * | congestion | S4 | 30.65 | * | 18 Mar 2021 low |
Asterisk denotes strength of level
02:50 GMT - Still little change, as prices extend consolidation above the 31.00 level. However, pressure remains on the downside and break here will expose the 28 January current year low at 30.86 to retest. Negative daily and weekly studies suggest scope for break here to further extend the broader losses from the October 2022 year high and see extension to the 30.80 congestion and the 30.65/30.50 area. Meanwhile, resistance at the 31.20/31.40 congestion area is expected to cap. Break here will ease the downside pressure and open up room for retest of the 31.58/31.70 resistance.