Published: 2026-01-05T05:22:02.000Z
Chart USD/IDR Updates: Extending gains
1
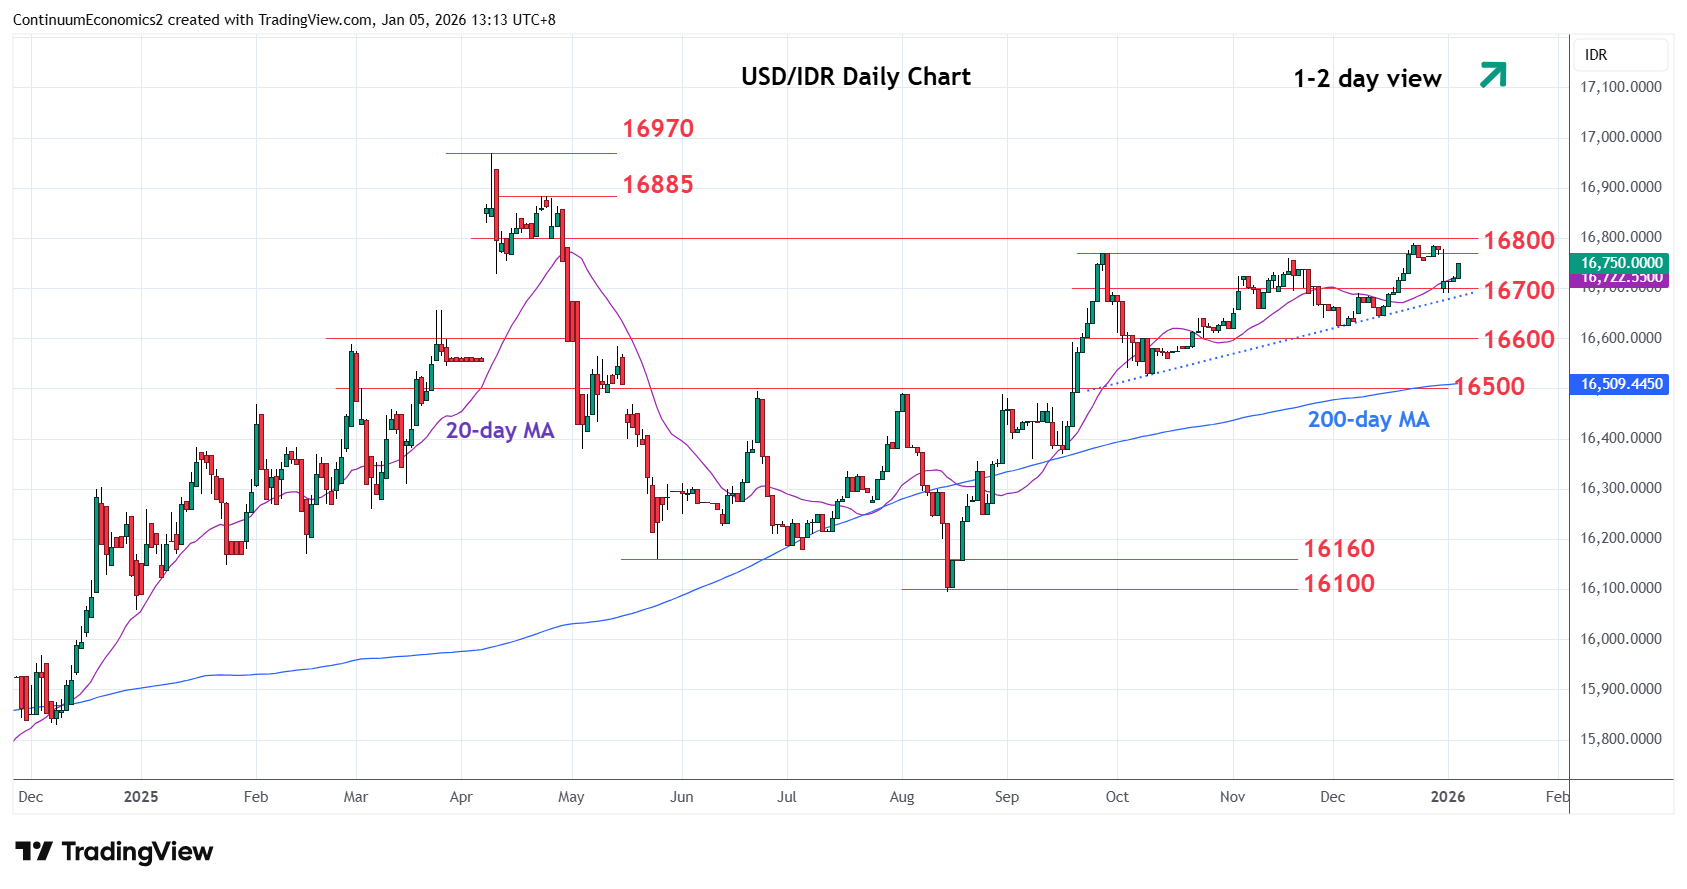
Bounce from the 16690 low of last week see prices sustaining gains within a broad ascending triangle from the late-September high
| Levels | Imp | Comment | Levels | Imp | Comment | |||
|---|---|---|---|---|---|---|---|---|
| R4 | 16970 | ** | 9 Apr YTD high | S1 | 16690 | * | 8 Dec high | |
| R3 | 16885 | * | 23 Apr high | S2 | 16625 | ** | 2 Dec low | |
| R2 | 16800 | * | congestion | S3 | 16600 | * | congestion | |
| R1 | 16770/90 | ** | Nov, Dec highs | S4 | 16525 | * | Oct low |
Asterisk denotes strength of level
05:15 GMT - Bounce from the 16690 low of last week see prices sustaining gains within a broad ascending triangle from the late-September high. Focus return to the 16770/16790, September/December highs. Break here will extend the broader gains from the 16100, August 2025 year low and see room for extension to resistance at 16885 then the 16970, April 2025 year high. Meanwhile, support is raised to 16700/16690 congestion and 8 December high should now underpin. Would take break to fade the upside pressure and negate the bullish ascending triangle pattern.