Published: 2025-11-18T05:23:49.000Z
Chart USD/INR Update: Extend consolidation below 88.8000 high
1
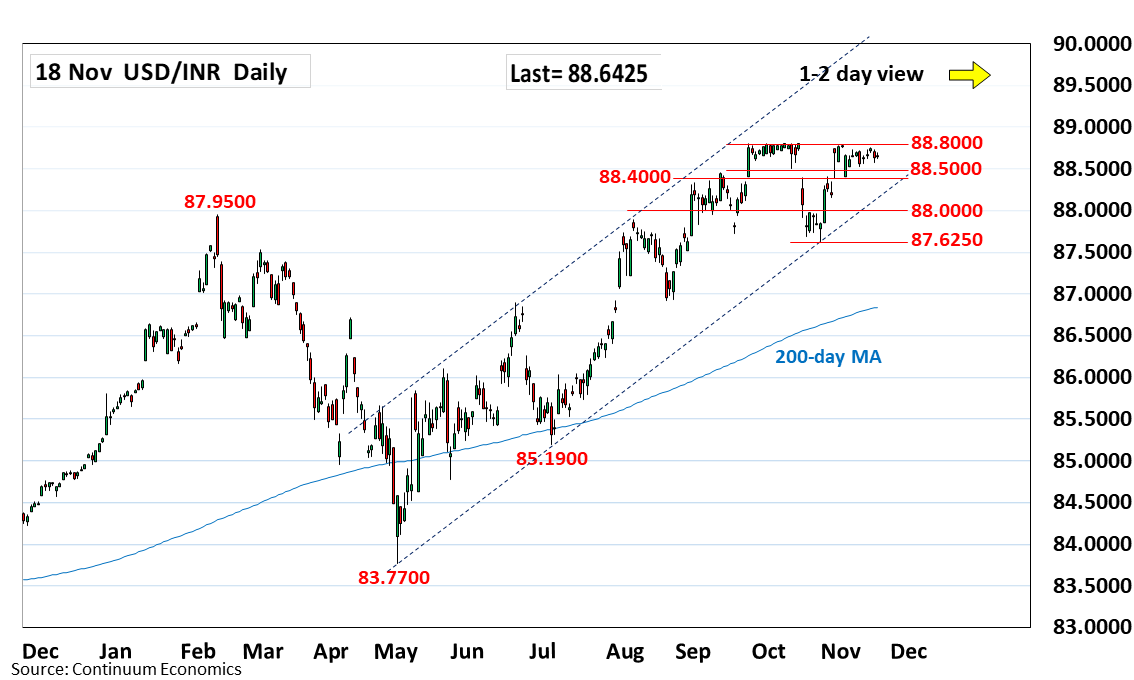
Little change, as prices extend consolidation below the 88.8000 all-time high
| Level | Comment | Level | Comment | |||||
|---|---|---|---|---|---|---|---|---|
| R4 | 89.5000 | * | projection | S1 | 88.4000 | * | 28 Oct high | |
| R3 | 89.2000 | * | projection | S2 | 88.0000 | * | congestion | |
| R2 | 89.0000 | * | figure | S3 | 87.6250 | ** | Oct low | |
| R1 | 88.8000 | ** | 30 Sep all-time high | S4 | 87.5000 | * | congestion |
Asterisk denotes strength of level
05:20 GMT - Little change, as prices extend consolidation below the 88.8000 all-time high. Would take break here to further extend the underlying bull trend and see room for extension to the 89.0000 figure. Meanwhile, support at the 88.5000/88.4000 area underpin but daily studies have turned lower and highlights scope for break here to open room for deeper pullback towards the 88.0000 level. Below the latter will threaten pullback to retest the 87.6250 October swing low and further retrace strong gains from the 83.7700, May low.