Published: 2026-04-08T04:46:37.000Z
Chart USD/INR Update: Extending losses
1
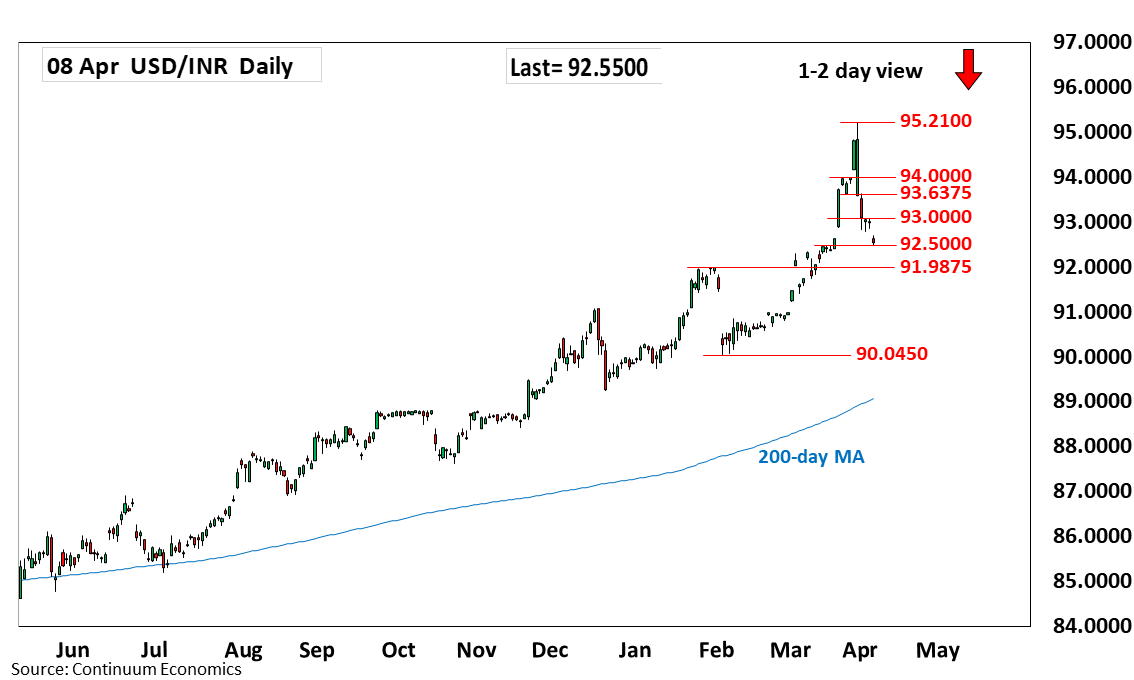
Break lower at the open to extend losses from the 95.2100 all-time high to reach support at the 92.5000 congestion
| Level | Comment | Level | Comment | |||||
|---|---|---|---|---|---|---|---|---|
| R4 | 94.8400 | * | 27 Mar high | S1 | 92.5000 | * | congestion | |
| R3 | 93.9800 | * | 23 Mar high | S2 | 91.9875 | ** | Jan high | |
| R2 | 93.6375 | ** | 24 Mar low | S3 | 91.7350 | 10 Mar low | ||
| R1 | 93.0850 | * | 6 Apr high | S4 | 91.4025 | * | 5 Mar low |
Asterisk denotes strength of level
04:40 GMT - Break lower at the open to extend losses from the 95.2100 all-time high to reach support at the 92.5000 congestion. Consolidation here see prices unwinding the stretched intraday studies but negative daily and weekly studies keeps pressure on the downside. Lower will further retrace strong gains from the 90.0450 February low and see room to critical support at 91.9875, January high. Meanwhile, resistance is lowered to the 93.0000/93.0850 congestion area which is expected to cap and sustain losses from 95.2100 high.