Published: 2026-05-07T04:16:49.000Z
Chart USD/MYR Update: Extending losses
1
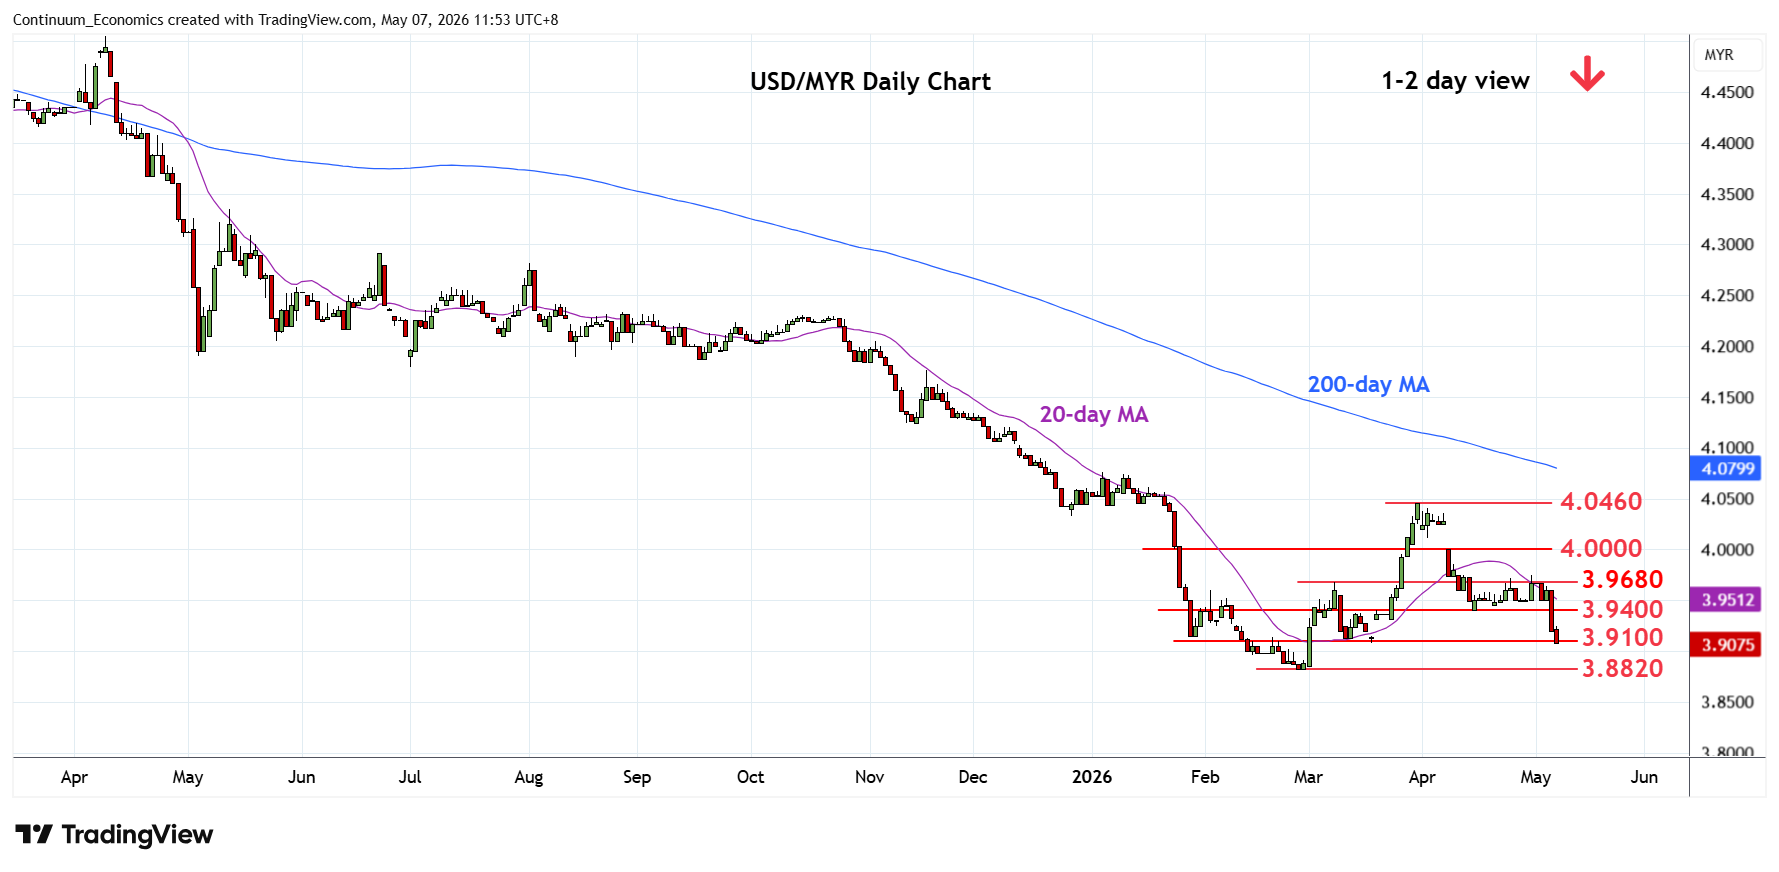
Sharply lower as prices extend break of support at the 3.9400 April low to reach support at the 3.9100/3.9000 congestion
| Levels | Imp | Comment | Levels | Imp | Comment | |||
|---|---|---|---|---|---|---|---|---|
| R4 | 4.0200 | * | congestion | S1 | 3.9000 | figure | ||
| R3 | 4.0000 | * | figure | S2 | 3.8820 | ** | 26 Feb YTD low | |
| R2 | 3.9680 | * | 9 Mar high | S3 | 3.8680 | * | Jan 2018 low | |
| R1 | 3.9400 | ** | Apr low | S4 | 3.8560 | ** | Apr 2018 year low |
Asterisk denotes strength of level
04:10 GMT - Sharply lower as prices extend break of support at the 3.9400 April low to reach support at the 3.9100/3.9000 congestion. Below this will expose the 3.8820 February current year low to retest and see scope for break to further extend losses from the 2024 year high. Lower will see room for extension to the January 2018 low at 3.8680. Lower still, will see retest of the 3.8560, April 2018 year low. Meanwhile, resistance is lowered to the 3.9400 April low which should cap corrective bounce and sustain losses from the 4.0460 March swing high.