Published: 2025-12-23T05:35:49.000Z
Chart USD/MYR Update: Extending losses
1
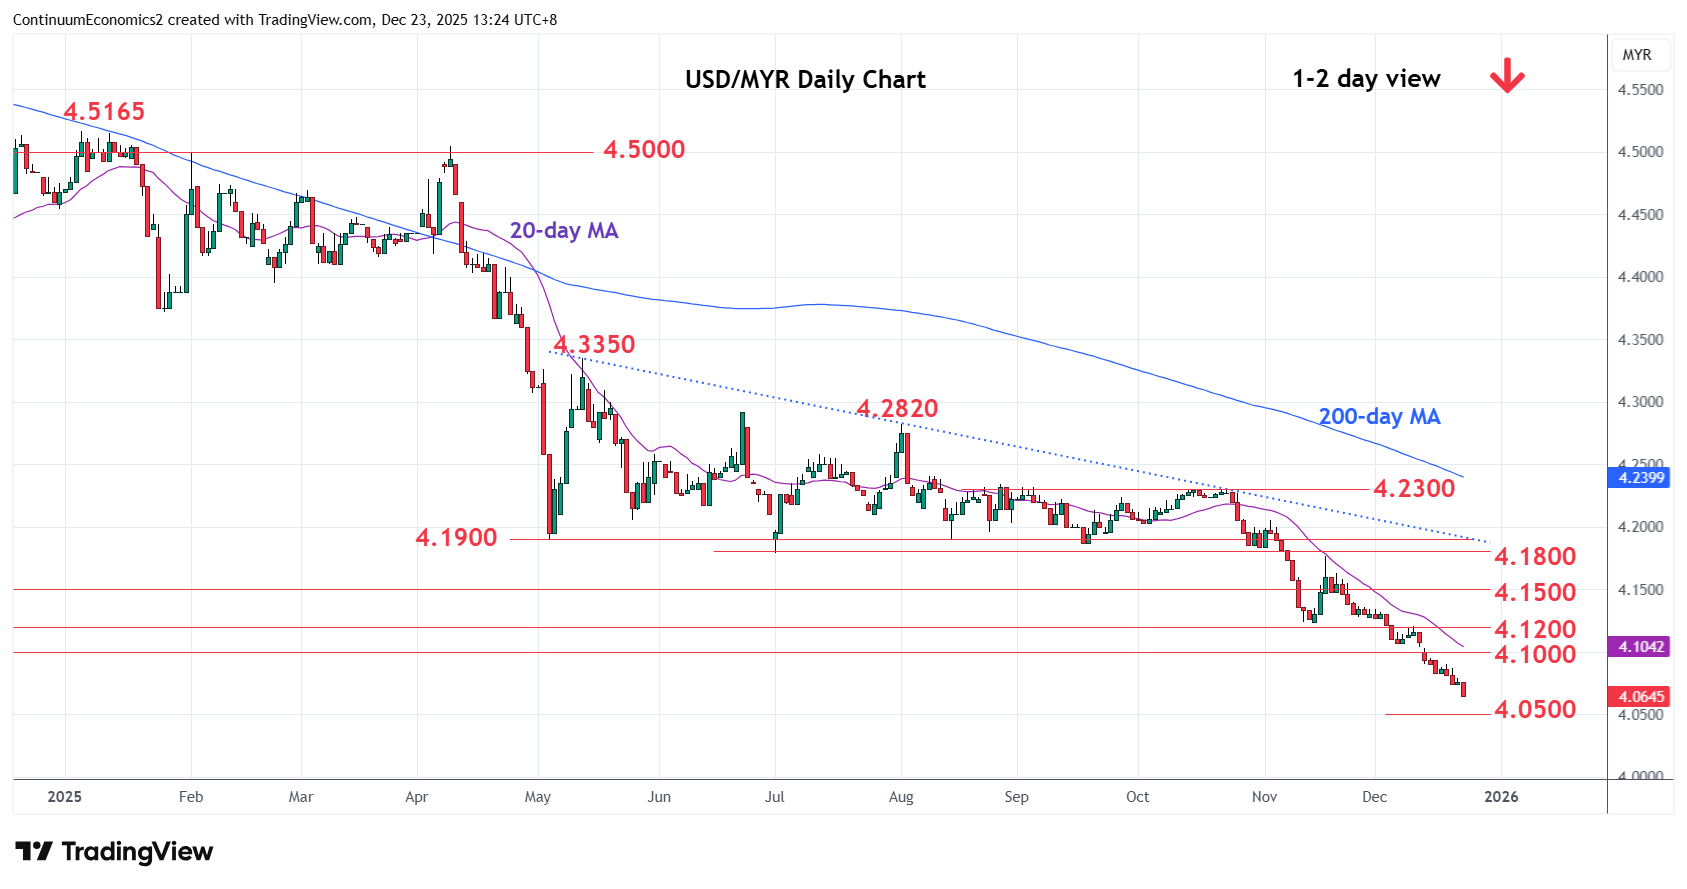
Still slipping as prices extend sharp losses from the 4.2300 October high to reach fresh year low at 4.0650
| Levels | Imp | Comment | Levels | Imp | Comment | |||
|---|---|---|---|---|---|---|---|---|
| R4 | 4.1470/00 | * | 18 Nov low, congestion | S1 | 4.0650 | * | Nov 2020 low | |
| R3 | 4.1240 | ** | 14 Nov low | S2 | 4.0500 | * | congestion | |
| R2 | 4.1000 | * | Sep 2024 year low | S3 | 4.0280 | * | Feb 2021 low | |
| R1 | 4.0800 | congestion | S4 | 4.0000 | ** | Jan 2021 year low |
Asterisk denotes strength of level
05:30 GMT - Still slipping as prices extend sharp losses from the 4.2300 October high to reach fresh year low at 4.0650. Pressure remains on the downside and lower will see room to the 4.0500 congestion. Lower still, if seen, will see room for extension to support at 4.0280 then 4.0000, January 2021 year low. Deep oversold daily studies caution corrective bounce with resistance starting at the 4.0800/4.1000 congestion and 2024 year low. Would need lift over these to ease the downside pressure and open up room for corrective bounce to retrace losses from the 4.2300, October high.