Published: 2026-03-24T02:38:54.000Z
Chart USD/SGD Update: Leaning lower from the 1.2850 resistance
2
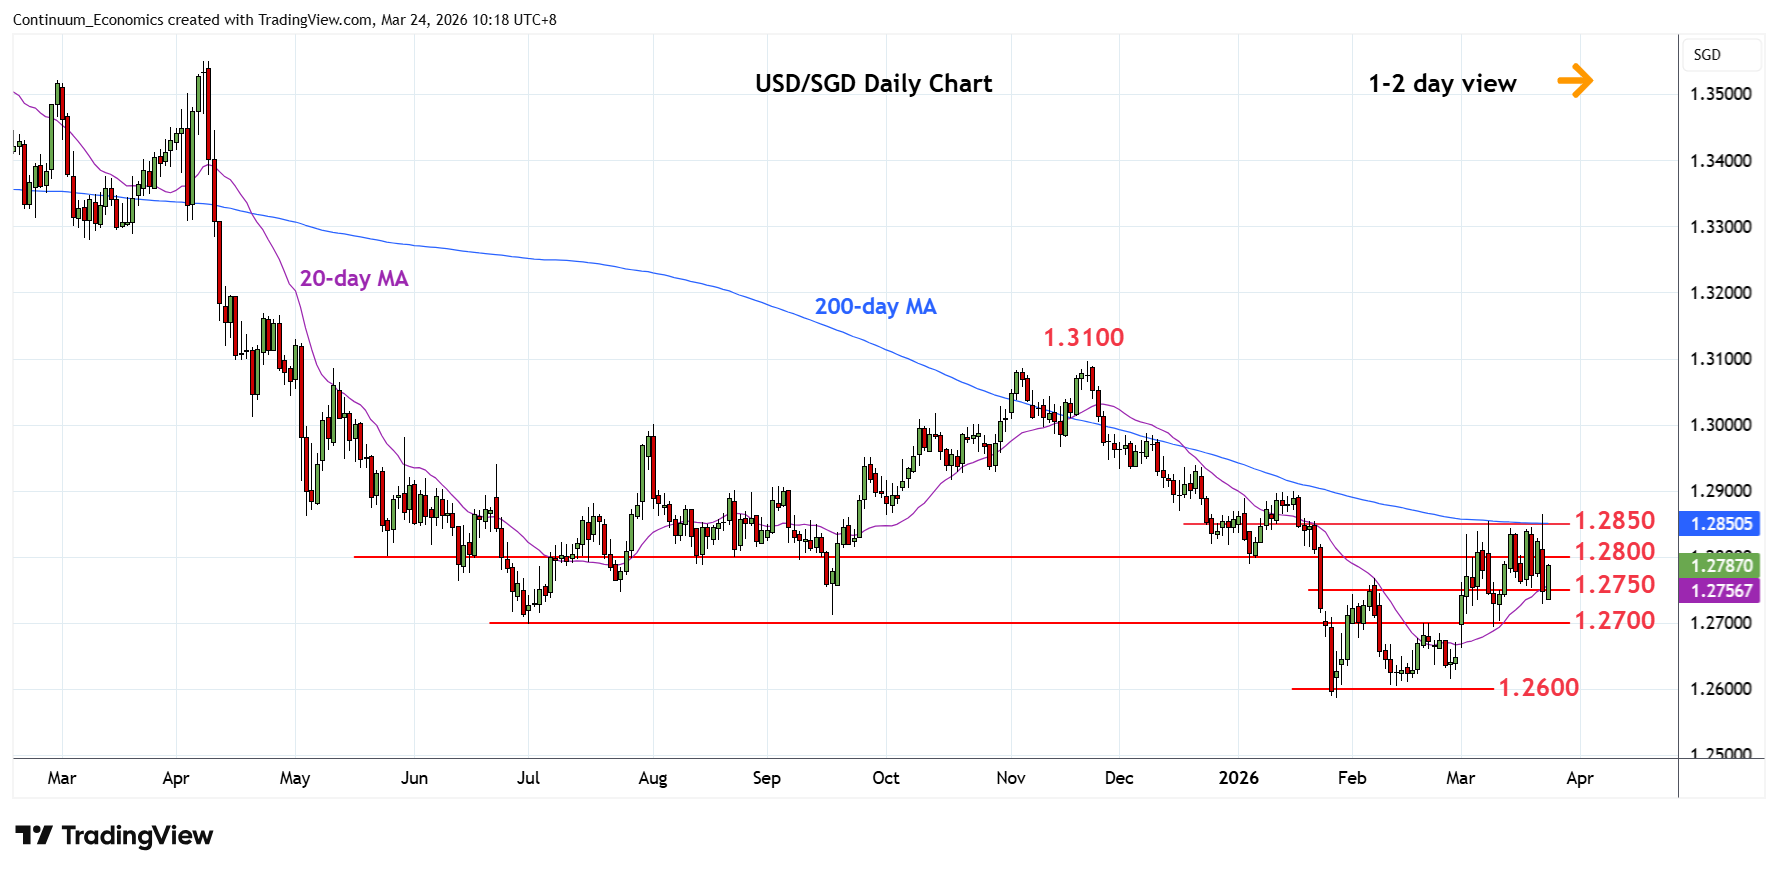
Leaning lower in consolidation as resistance at the 1.2850 congestion and 200-day MA caps
| Level | Comment | Level | Comment | ||||
|---|---|---|---|---|---|---|---|
| R4 | 1.2938 | 19 Dec high | S1 | 1.2750 | * | congestion | |
| R3 | 1.2900 | ** | 16 Jan YTD high, 61.8% | S2 | 1.2700 | ** | 19 Feb high, 2025 yr low |
| R2 | 1.2850 | ** | congestion, 200-day MA | S3 | 1.2650 | congestion | |
| R1 | 1.2800 | * | congestion | S4 | 1.2586 | ** | 28 Jan YTD low |
Asterisk denotes strength of level
02:25 GMT - Leaning lower in consolidation as resistance at the 1.2850 congestion and 200-day MA caps. Pressure return to the 1.2750 support and break here will see room for pullback to retest strong support at the 1.2700 level. Break here will return focus to the downside for retest of the 1.2600 level and 1.2586 low. Meanwhile, resistance at the 1.2800/1.2850 congestion and 200-day MA expected to cap. Would take break here to open room for stronger gains to retrace losses from the November high and see room to retest the 1.2900, 16 January current year high and 61.8% Fibonacci level.