Published: 2025-10-07T04:49:33.000Z
Chart USD/INR Update: Drift narrowly below 88.8000, all-time high
2
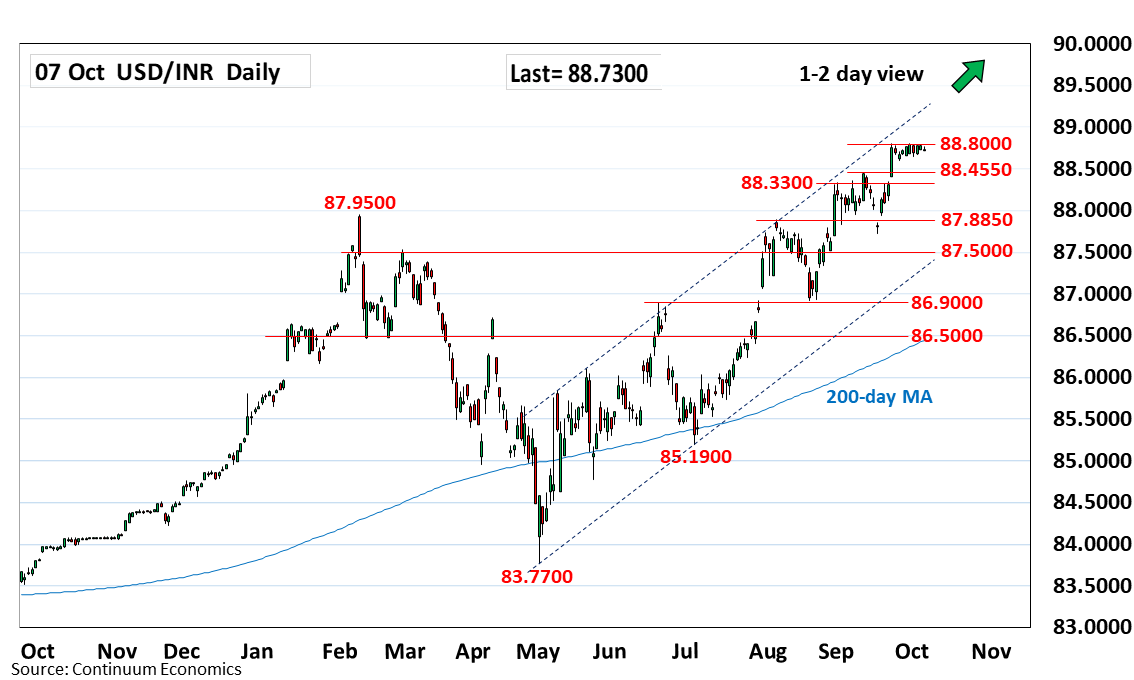
Still little change, as prices drift narrowly below the 88.8000 all-time high
| Level | Comment | Level | Comment | |||||
|---|---|---|---|---|---|---|---|---|
| R4 | 91.5000 | * | projection | S1 | 88.4450 | ** | 11 Sep high | |
| R3 | 90.0000 | ** | psychological | S2 | 88.3300 | * | 1 Sep high | |
| R2 | 89.0000 | * | figure | S3 | 88.0000 | * | congestion | |
| R1 | 88.8000 | ** | 30 Sep all-time high | S4 | 87.8850 | ** | 5 Aug high |
Asterisk denotes strength of level
04:45 GMT - Still little change, as prices drift narrowly below the 88.8000 all-time high. Pressure remains on the upside and see room to further extend gains within the bullish channel from the 83.7700, May low. Clearance will see room to the 89.0000 figure then the 90.0000 psychological level. However, overbought daily and weekly studies caution corrective pullback to the September highs turned support at the 88.4450/88.3300 area. Would take break here to fade the upside pressure and open up room to correct strong gains from the 85.1900, July low.