Published: 2026-03-06T02:44:15.000Z
Chart USD/THB Update: Consolidating, room for higher later
1
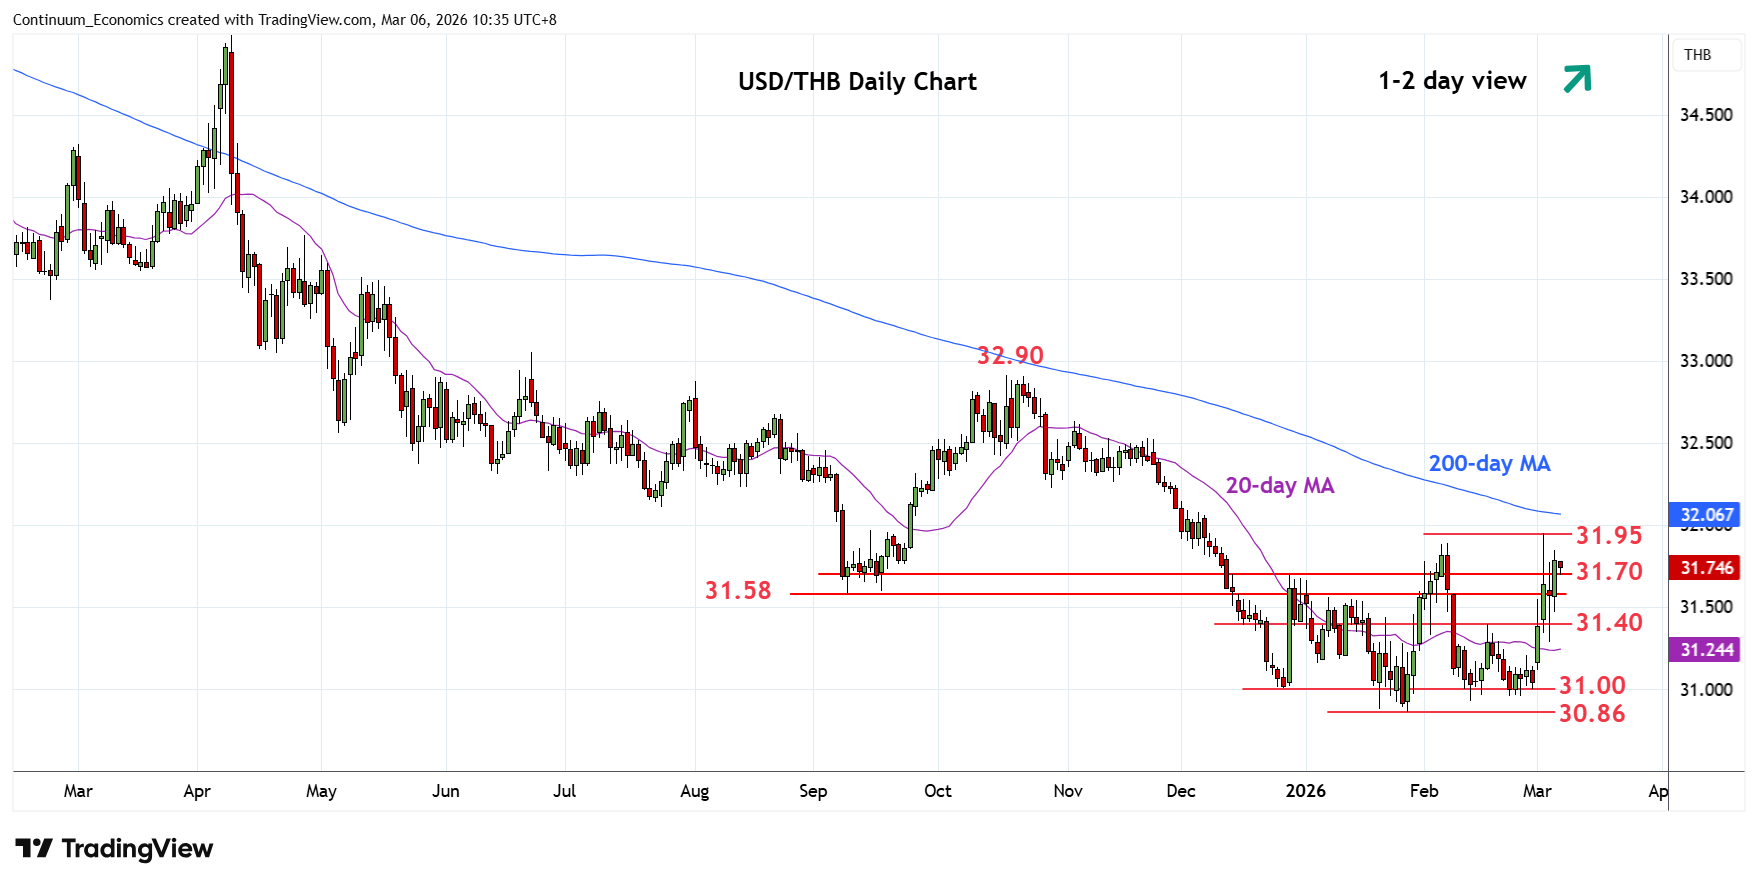
Lower in consolidation from the 31.95, 3 March current year high, as prices unwind overbought intraday studies
| Level | Comment | Level | Comment | |||||
|---|---|---|---|---|---|---|---|---|
| R4 | 32.20/23 | ** | congestion, Oct low | S1 | 31.60/58 | * | congestion, Sep low | |
| R3 | 32.12 | * | 61.8% Oct/Jan fall | S2 | 31.40 | ** | 17 Feb high | |
| R2 | 31.95 | ** | 3 Mar YTD high | S3 | 31.20 | * | congestion | |
| R1 | 31.89 | * | Feb high | S4 | 31.00 | * | congestion |
Asterisk denotes strength of level
02:40 GMT - Lower in consolidation from the 31.95, 3 March current year high, as prices unwind overbought intraday studies. Consolidation is expected to give way to renewed buying interest later and break above resistance at the 31.89/31.95 highs will see room for stronger gains to retrace losses from the October high to 32.12, 61.8% Fibonacci level. Higher still, will see extension to strong resistance at 32.20/32.23 congestion and low of October. Meanwhile, support is raised to 31.60/31.58 congestion area which should underpin and sustain bounce from the 31.00 congestion area.