Published: 2026-04-10T02:11:43.000Z
Chart USD/SGD Update: Consolidating at 1.2730/00 support
1
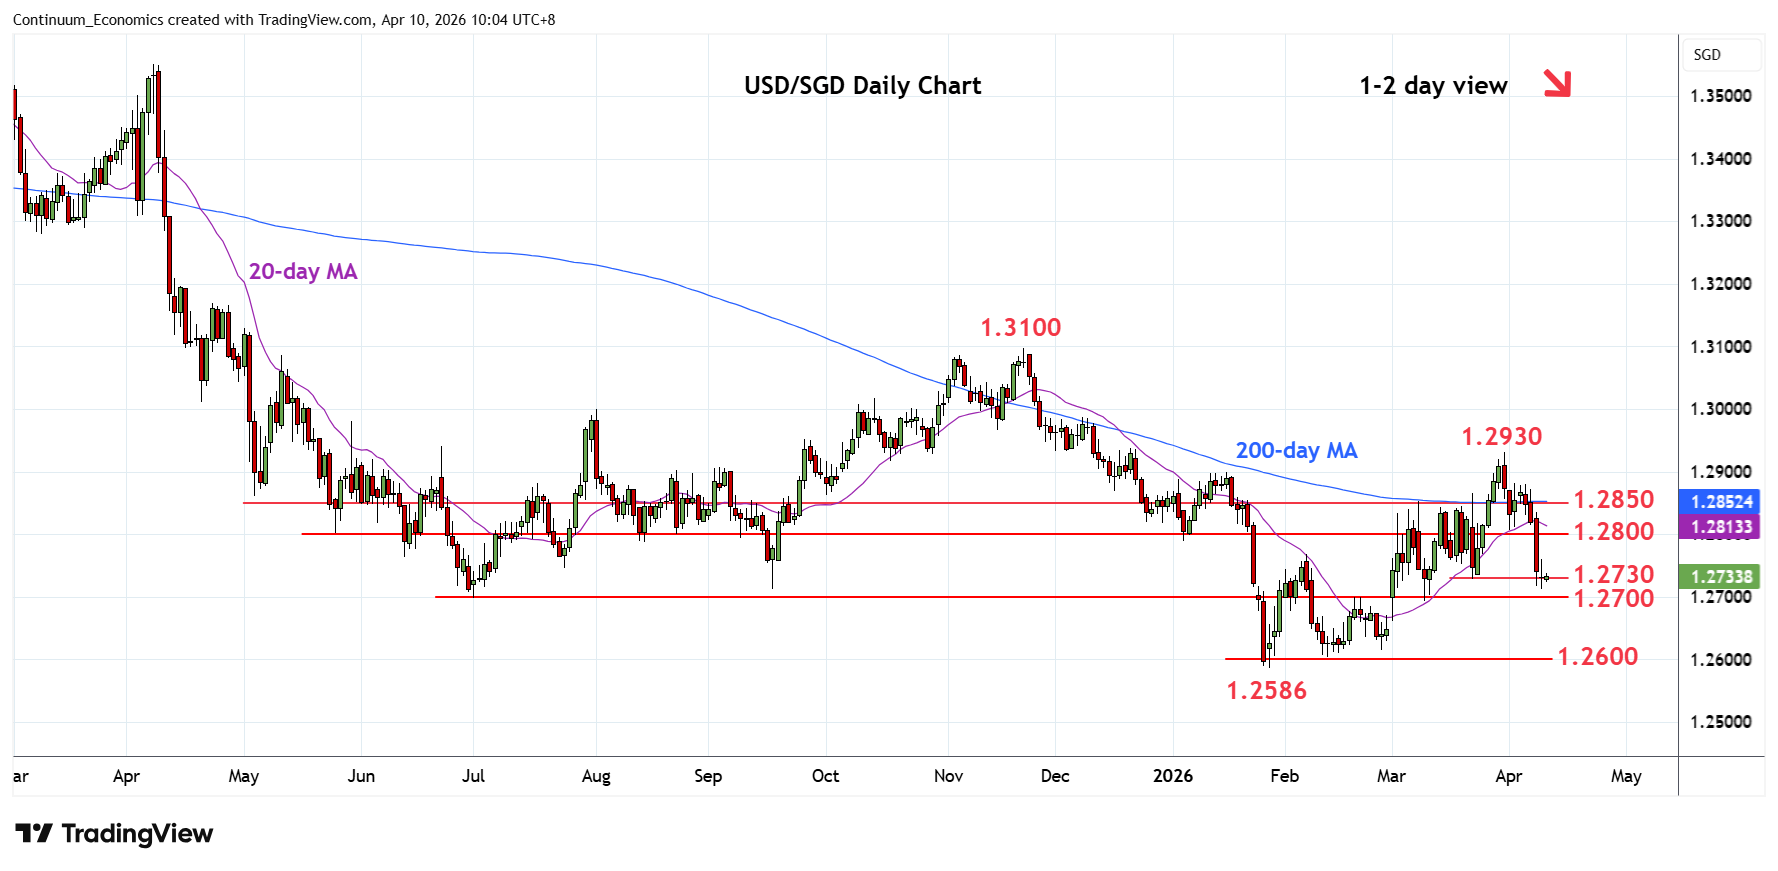
Consolidating test of strong support at the 1.2730/1.2700, 23 March low and congestion area as prices unwind oversold intraday studies
| Level | Comment | Level | Comment | ||||
|---|---|---|---|---|---|---|---|
| R4 | 1.2930 | ** | 31 Mar high | S1 | 1.2730 | * | 23 Mar low |
| R3 | 1.2900 | * | Jan high | S2 | 1.2700 | ** | 19 Feb high, 2025 yr low |
| R2 | 1.2850 | * | congestion | S3 | 1.2650 | congestion | |
| R1 | 1.2800 | * | congestion | S4 | 1.2600 | * | congestion |
Asterisk denotes strength of level
02:10 GMT - Consolidating test of strong support at the 1.2730/1.2700, 23 March low and congestion area as prices unwind oversold intraday studies. However, pressure remains on the downside and with negative daily and weekly studies suggesting scope for further losses later. Break here will open up room for extension to the 1.2650/00 congestion area then the 1.2586, January current year low. Meanwhile, resistance remains at the 1.2800 congestion which is expected to cap and sustain losses from the 1.2930 YTD high.