Published: 2026-04-06T03:02:19.000Z
Chart USD/THB Update: Lower in consolidation from 33.05 high
-
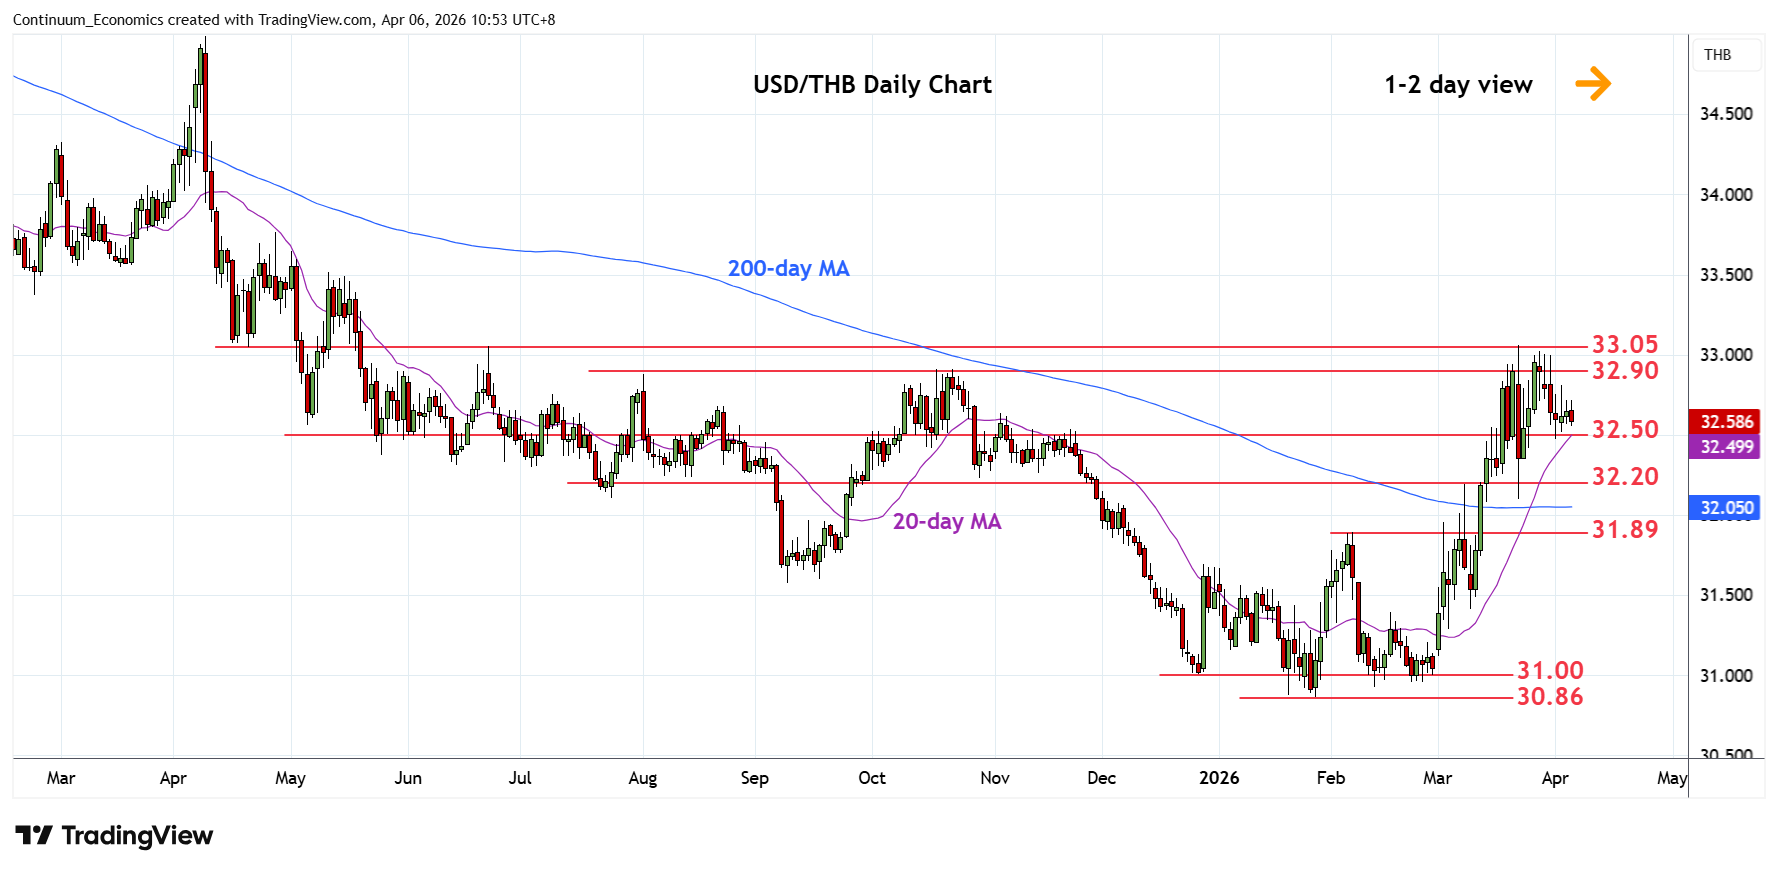
Settled back in consolidation below the 33.05 March current year high as prices unwind overbought daily and weekly studies
| Level | Comment | Level | Comment | |||||
|---|---|---|---|---|---|---|---|---|
| R4 | 33.42 | * | 61.8% 2025/Jan fall | S1 | 32.50/35 | * | congestion | |
| R3 | 33.20 | * | congestion | S2 | 32.20 | * | congestion | |
| R2 | 33.05 | ** | 23 Mar YTD high | S3 | 32.10 | * | 23 Mar low | |
| R1 | 32.90 | * | Oct high | S4 | 31.89 | ** | Feb high |
Asterisk denotes strength of level
02:50 GMT - Settled back in consolidation below the 33.05 March current year high as prices unwind overbought daily and weekly studies. Pullback see support at the 32.50/35 congestion area and break here needed to open up room for deeper pullback to retrace strong gains from the February/January lows. Lower will see room to support at the 32.20/10 area and 31.89, February high. Meanwhile, resistance at the 32.90 and 33.05 high expected to cap. Clearance will further losses from the April 2025 high and see room to 33.20 congestion.