Published: 2025-11-05T05:08:44.000Z
Chart USD/IDR Updates: Consolidate test of 16700/16730 resistance
8
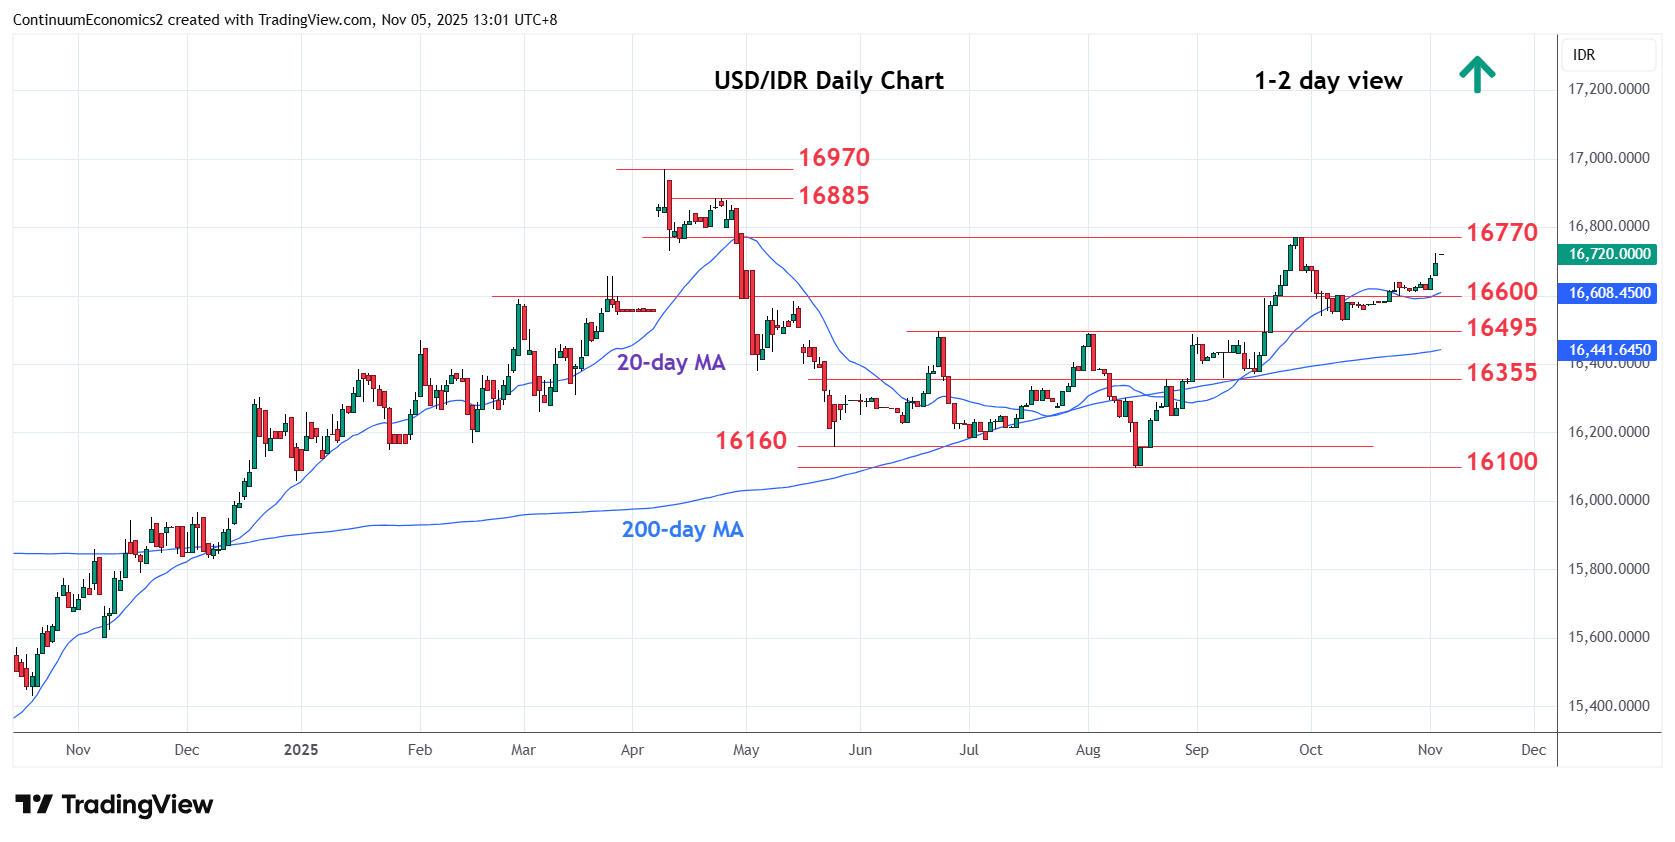
No follow-through on break above the 16700 as price settled back from test of the 16700/16730 resistance
| Levels | Imp | Comment | Levels | Imp | Comment | |||
|---|---|---|---|---|---|---|---|---|
| R4 | 16885 | * | 23 Apr high | S1 | 16600 | * | congestion | |
| R3 | 16800 | * | congestion | S2 | 16525 | * | 9 Oct low | |
| R2 | 16770 | ** | 26 Sep high | S3 | 16495 | ** | Jun high | |
| R1 | 16700 | * | figure | S4 | 16355/350 | * | 61.8%, congestion |
Asterisk denotes strength of level
05:10 GMT - No follow-through on break above the 16700 as price settled back from test of the 16700/16730 resistance. Clearance will see room to retest the 16770 high of September where reaction is expected as daily studies push into overbought areas. Break here, if seen, will extend the broader gains from the 16100 August low and see room to 16800 congestion and 16885 resistance. Meanwhile, support is at 16640/16600 congestion area which should underpin. Would take break here to return focus to the downside for retest of the 16525 October low and 16495, June-August range highs.