Published: 2025-11-19T03:01:08.000Z
Chart USD/CNH Update: Consolidating test of 7.1160 resistance
1
Consolidating test of the 7.1160 resistance
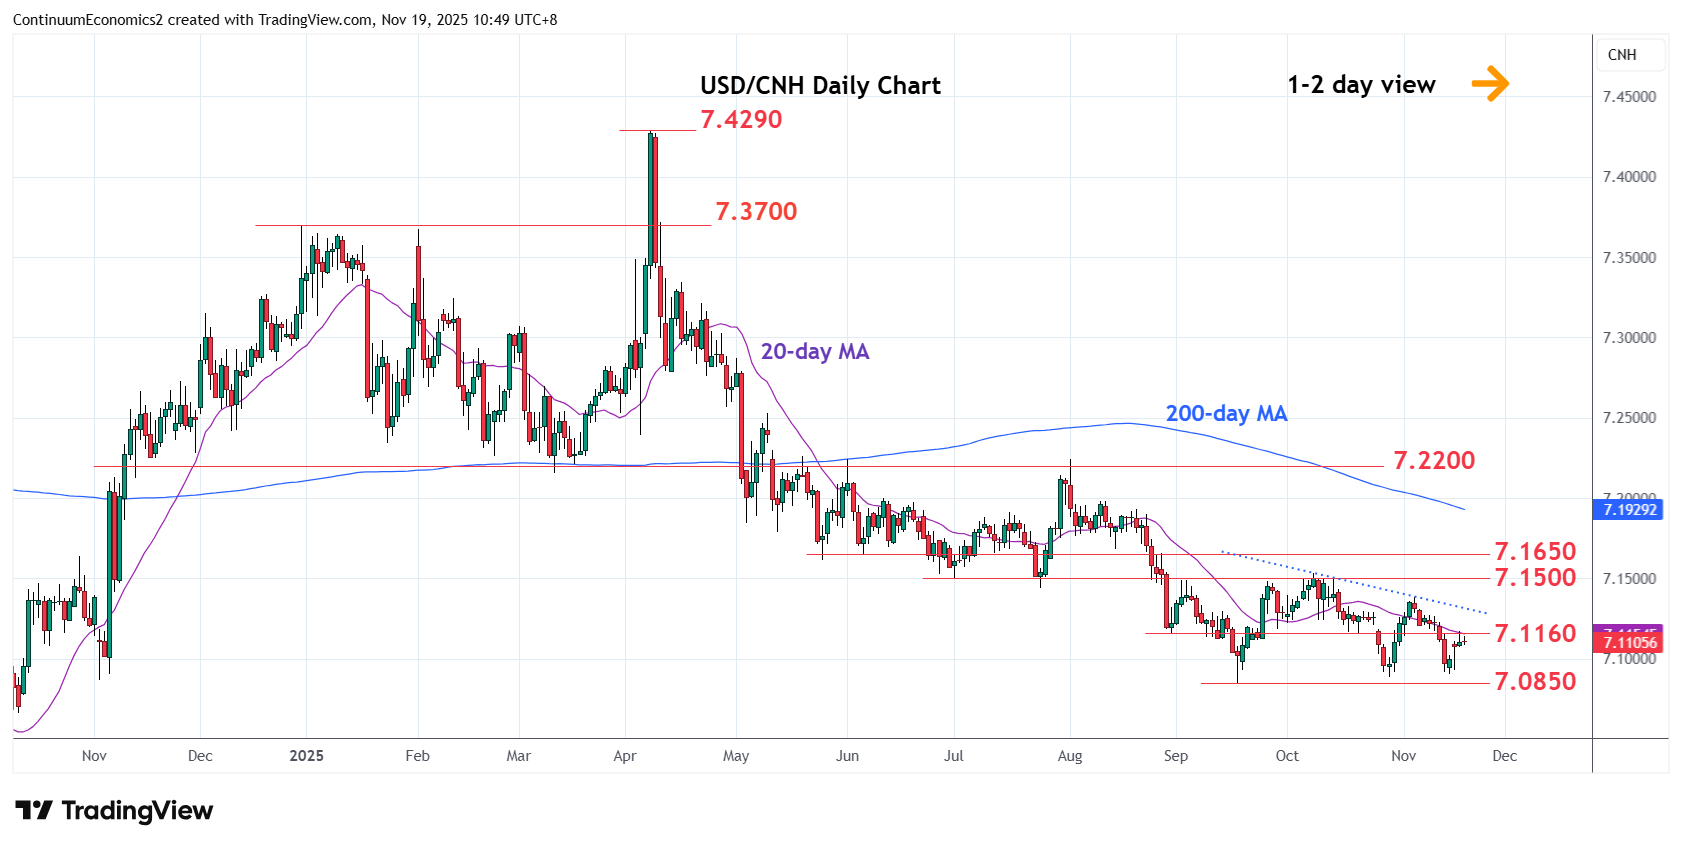
| Level | Imp | Comment | Level | Imp | Comment | |||
|---|---|---|---|---|---|---|---|---|
| R4 | 7.1650 | * | congestion | S1 | 7.0885 | * | Oct low | |
| R3 | 7.1500/35 | ** | congestion, Oct high | S2 | 7.0850 | ** | 17 Sep YTD low | |
| R2 | 7.1385 | * | 5 Nov high | S3 | 7.0800 | * | 76.4% Sep 2024/Apr rally | |
| R1 | 7.1160 | * | Aug low, congestion | S4 | 7.0600 | * | congestion |
Asterisk denotes strength of level
03:00 GMT - Consolidating test of the 7.1160 resistance as prices unwind overbought intraday studies. Break here will open up room for stronger gains from the 7.0905 low of last week and see extension to retest resistance at the 7.1385 and 7.1535, 5 November and October highs. However, this area is expected to cap and give way to renewed selling pressure later. Below the 7.1000 figure will expose the 7.0885 and 7.0850 lows to retest. Break of these will extend the April losses and see extension to 7.0800 level and 76.4% Fibonacci level.