Published: 2025-12-04T04:42:45.000Z
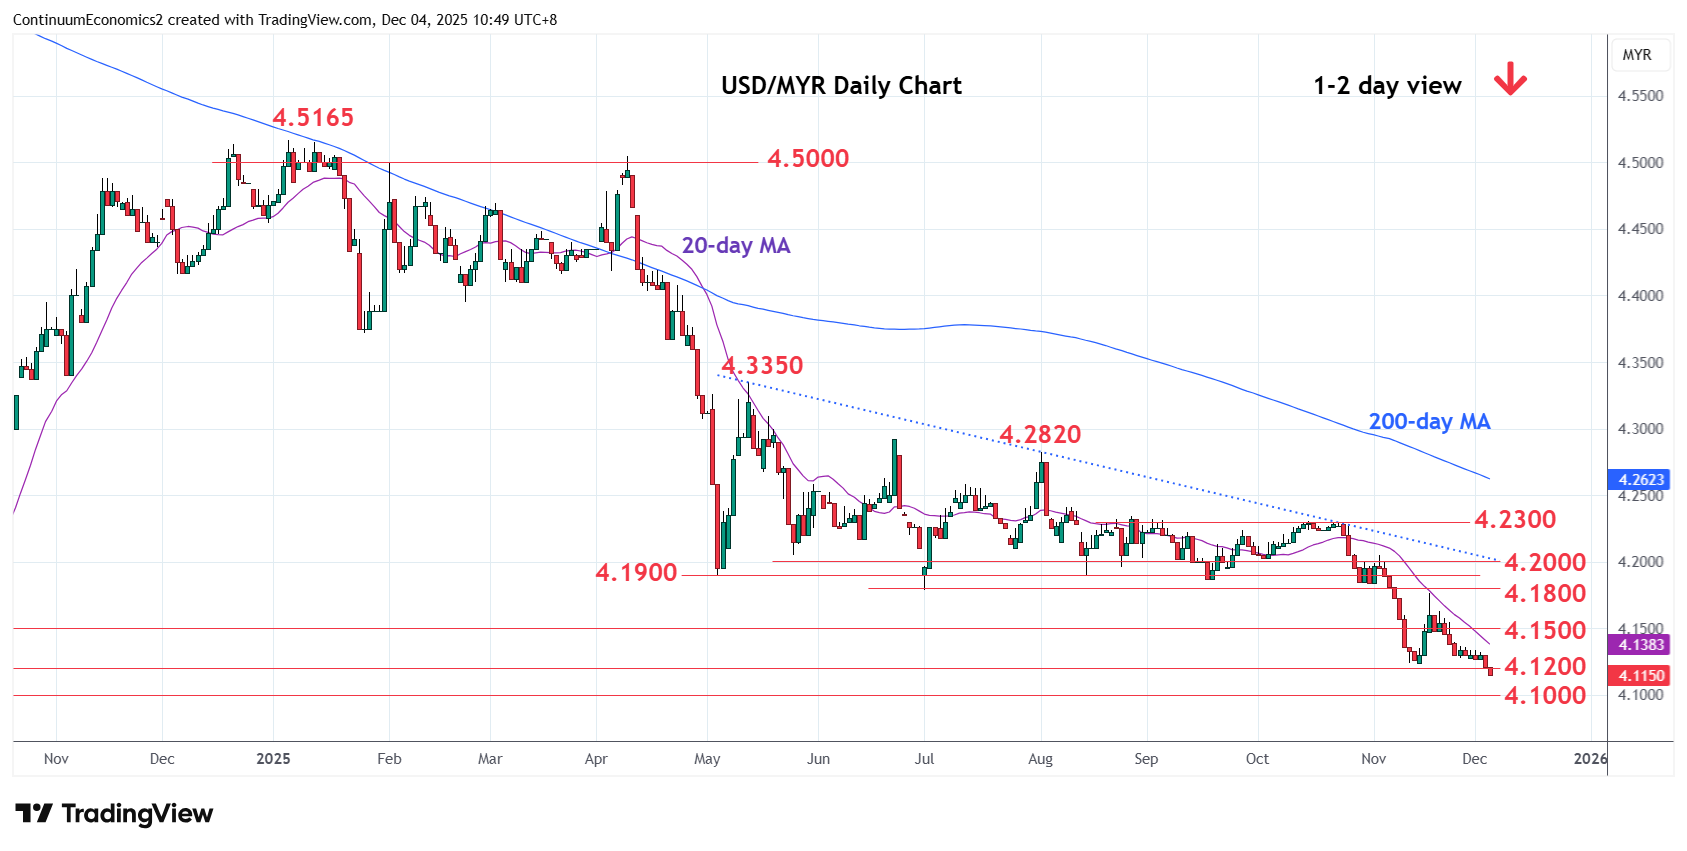
Chart USD/MYR Update: Extending losses, room to 4.1000
-
Break of the 4.1240 November low and 4.1200 level see prices extending to fresh year low
| Levels | Imp | Comment | Levels | Imp | Comment | |||
|---|---|---|---|---|---|---|---|---|
| R4 | 4.1900 | ** | May low | S1 | 4.1000 | ** | Sep 2024 year low | |
| R3 | 4.1800 | ** | Jul low | S2 | 4.0900 | * | Apr 2021 low | |
| R2 | 4.1470/00 | * | 18 Nov low, congestion | S3 | 4.0800 | * | congestion | |
| R1 | 4.1240 | ** | 14 Nov low | S4 | 4.0780 | * | 76.4% 2018/2024 rally |
Asterisk denotes strength of level
04:35 GMT - Break of the 4.1240 November low and 4.1200 level see prices extending to fresh year low. Focus now shift focus to the 4.1000, September 2024 year low. However, daily and weekly studies are deep into oversold areas and suggest reaction at the latter likely. A later break of the 4.1000 low, if seen, will further retrace the 2018/2024 rally and see room to support at 4.0780/7.0750, 76.4% Fibonacci level and congestion. Meanwhile, resistance is lowered to the 4.1240 November low which is expected to cap.