Published: 2026-01-19T05:19:06.000Z
Chart USD/INR Update: Extending gains
-
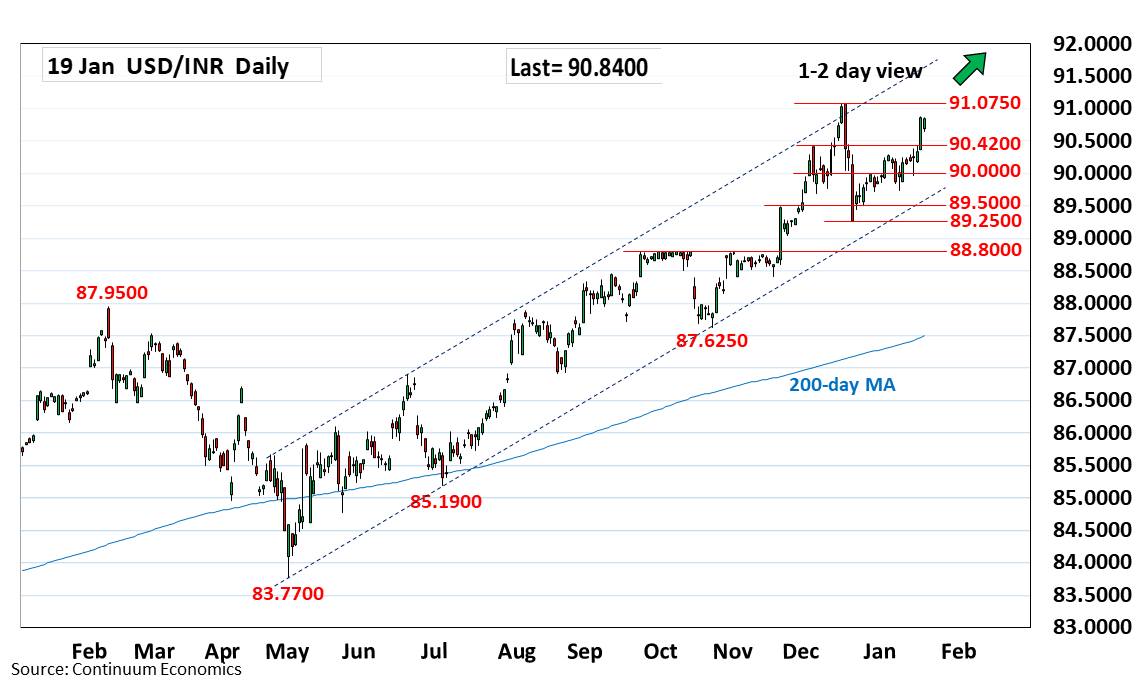
Further extend bounce from the 89.2500 December low to reach 90.8700 high as prices retrace losses from the 91.0750 record high
| Level | Comment | Level | Comment | |||||
|---|---|---|---|---|---|---|---|---|
| R4 | 91.5500 | * | projection | S1 | 90.4200 | * | 4 Dec high | |
| R3 | 91.5000 | * | projection | S2 | 90.2900 | ** | 5 Jan high | |
| R2 | 91.0750 | ** | Dec 2025 all-time high | S3 | 90.0000 | ** | congestion | |
| R1 | 90.8700 | * | 16 Jan high | S4 | 89.7400 | * | 8 Jan low |
Asterisk denotes strength of level
05:15 GMT - Further extend bounce from the 89.2500 December low to reach 90.8700 high as prices retrace losses from the 91.0750 record high. Overbought daily studies suggest reaction at the latter can be expected and give way to renewed selling pressure. However, a later break cannot be ruled out to extend the underlying bull trend. Meanwhile, support is raised to the 90.4200/90.2900 area which is expected to underpin. Would take break here to open up room for deeper pullback to retrace gains from the 89.2500 December low towards the 90.0000 figure and 89.7400 support.