Published: 2026-04-30T03:12:49.000Z
Chart USD/THB Update: Extending gains
1
Consolidation below the 32.50 congestion has given way to break to retest strong resistance at the 32.70/80 congestion area
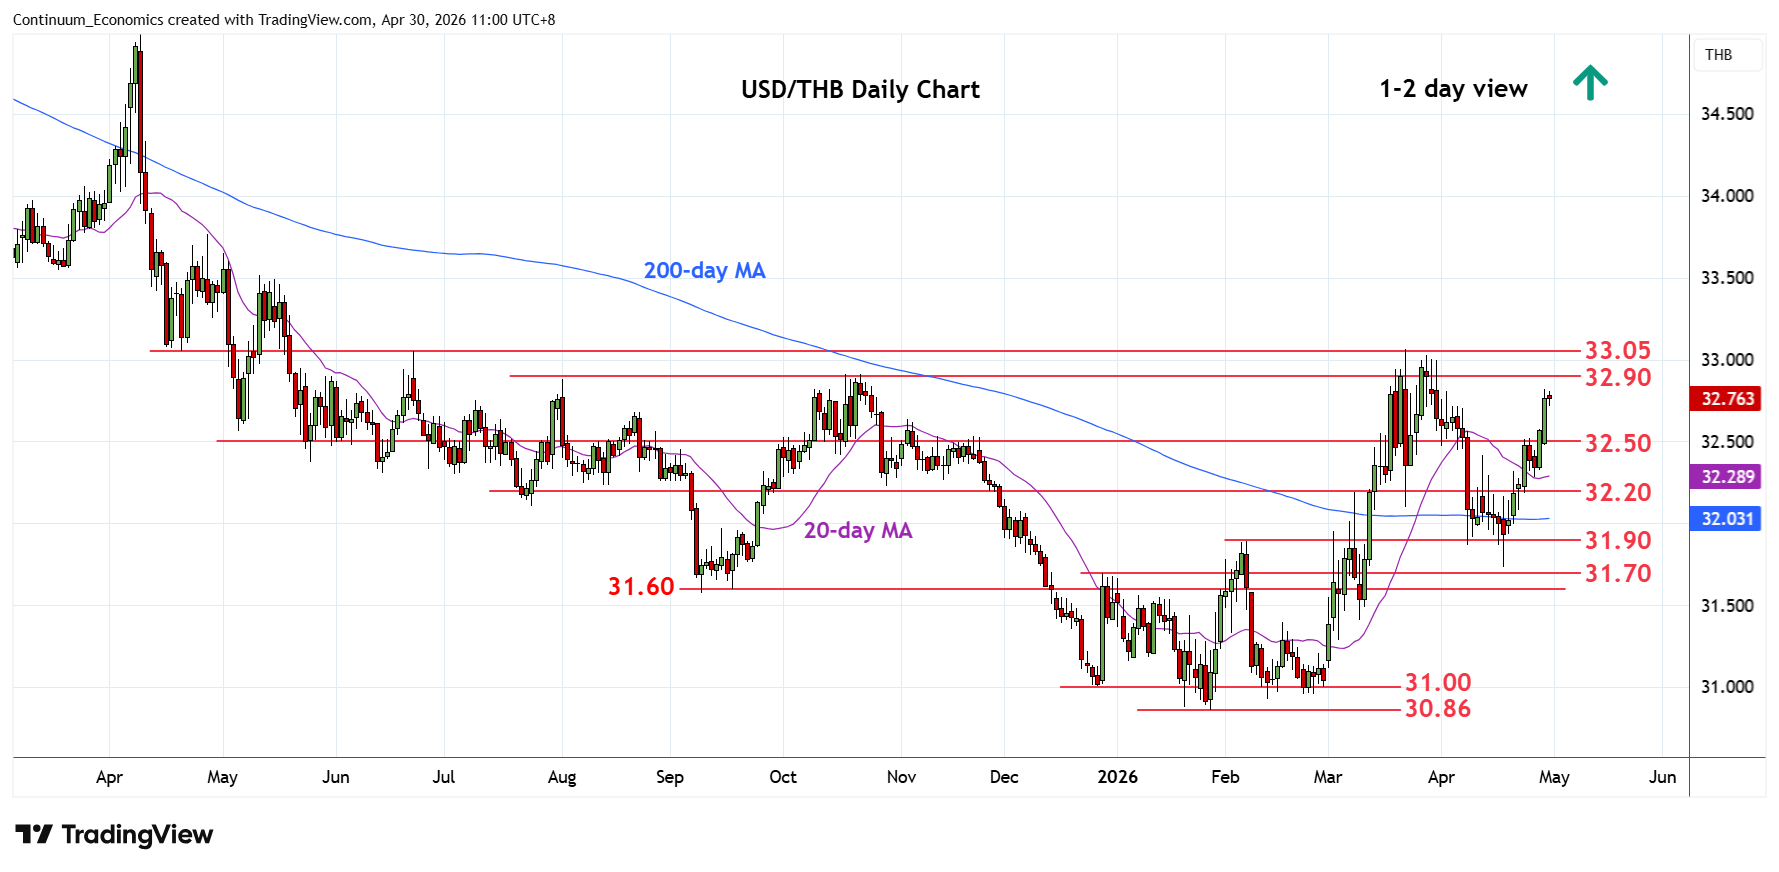
| Level | Comment | Level | Comment | |||||
|---|---|---|---|---|---|---|---|---|
| R4 | 33.30 | * | 38.2% 2025/Jan fall | S1 | 32.50 | ** | congestion | |
| R3 | 33.05 | ** | 23 Mar YTD high | S2 | 32.30 | * | congestion | |
| R2 | 32.90 | * | Oct high, congestion | S3 | 32.20 | * | congestion | |
| R1 | 32.80 | * | congestion | S4 | 31.90 | ** | Feb high |
Asterisk denotes strength of level
03:10 GMT - Consolidation below the 32.50 congestion has given way to break to retest strong resistance at the 32.70/80 congestion area. Gains beyond this, if seen, will expose strong resistance at 32.90 October high and 33.05 March current year high to retest. Higher still, if seen, will further extend gains from the January current year low at 30.86 and see room to 33.30, 38.2% Fibonacci retracement. Meanwhile, support is raised to the 32.50 congestion. Would take break here to return focus to the downside for retest of support at the 32.40/30 area and 32.20 congestion.