Published: 2025-10-29T02:29:31.000Z
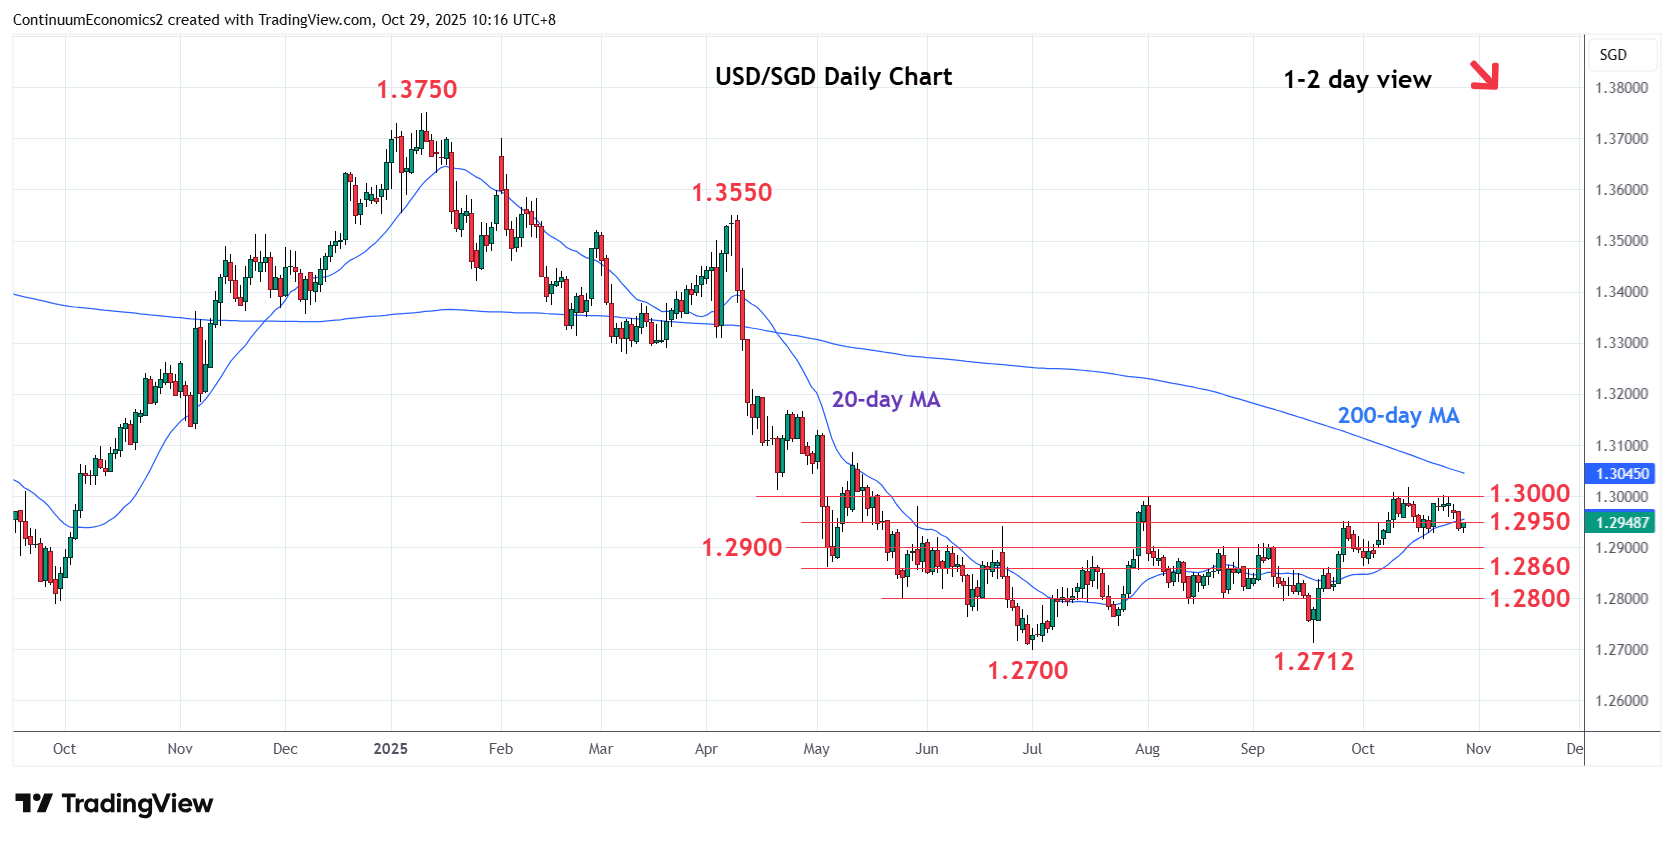
Chart USD/SGD Update: Extending pullback from 1.3000 resistance
-
Consolidation below the 1.3000 level has given way to selling pressure
| Level | Comment | Level | Comment | ||||
|---|---|---|---|---|---|---|---|
| R4 | 1.3100 | * | 38.2% Jan/Jul fall | S1 | 1.2917/00 | ** | 17 Oct low, congestion |
| R3 | 1.3085 | * | 12 May high | S2 | 1.2860 | * | 5 May low |
| R2 | 1.3000/18 | ** | Aug, 14 Oct highs | S3 | 1.2800 | * | 26 May low, congestion |
| R1 | 1.2950/60 | * | congestion | S4 | 1.2750 | * | congestion |
Asterisk denotes strength of level
02:20 GMT - Consolidation below the 1.3000 level has given way to selling pressure with break of support at 1.2950 congestion turning focus to the 1.2917, 17 October low. Below this and the 1.2900 congestion will open up room for deeper pullback to retrace gains from the 1.2712 September low and see room to support at the 1.2860/1.2800, May lows. Meanwhile, resistance is lowered to the 1.2950/60 congestion area now expected to cap. Regaining this, will open up room for retest of the 1.3000/18 highs.